Free HAR file viewer
Drop in a .har file above and read every request it captured: headers, cookies, payloads, timings and a full waterfall. This is the Web Debugger from GraphDagger, running read-only in your browser.
Your file is parsed in this tab and never uploaded. HAR captures usually contain session cookies and authorisation headers, so it stays on your machine.
Every request, opened up
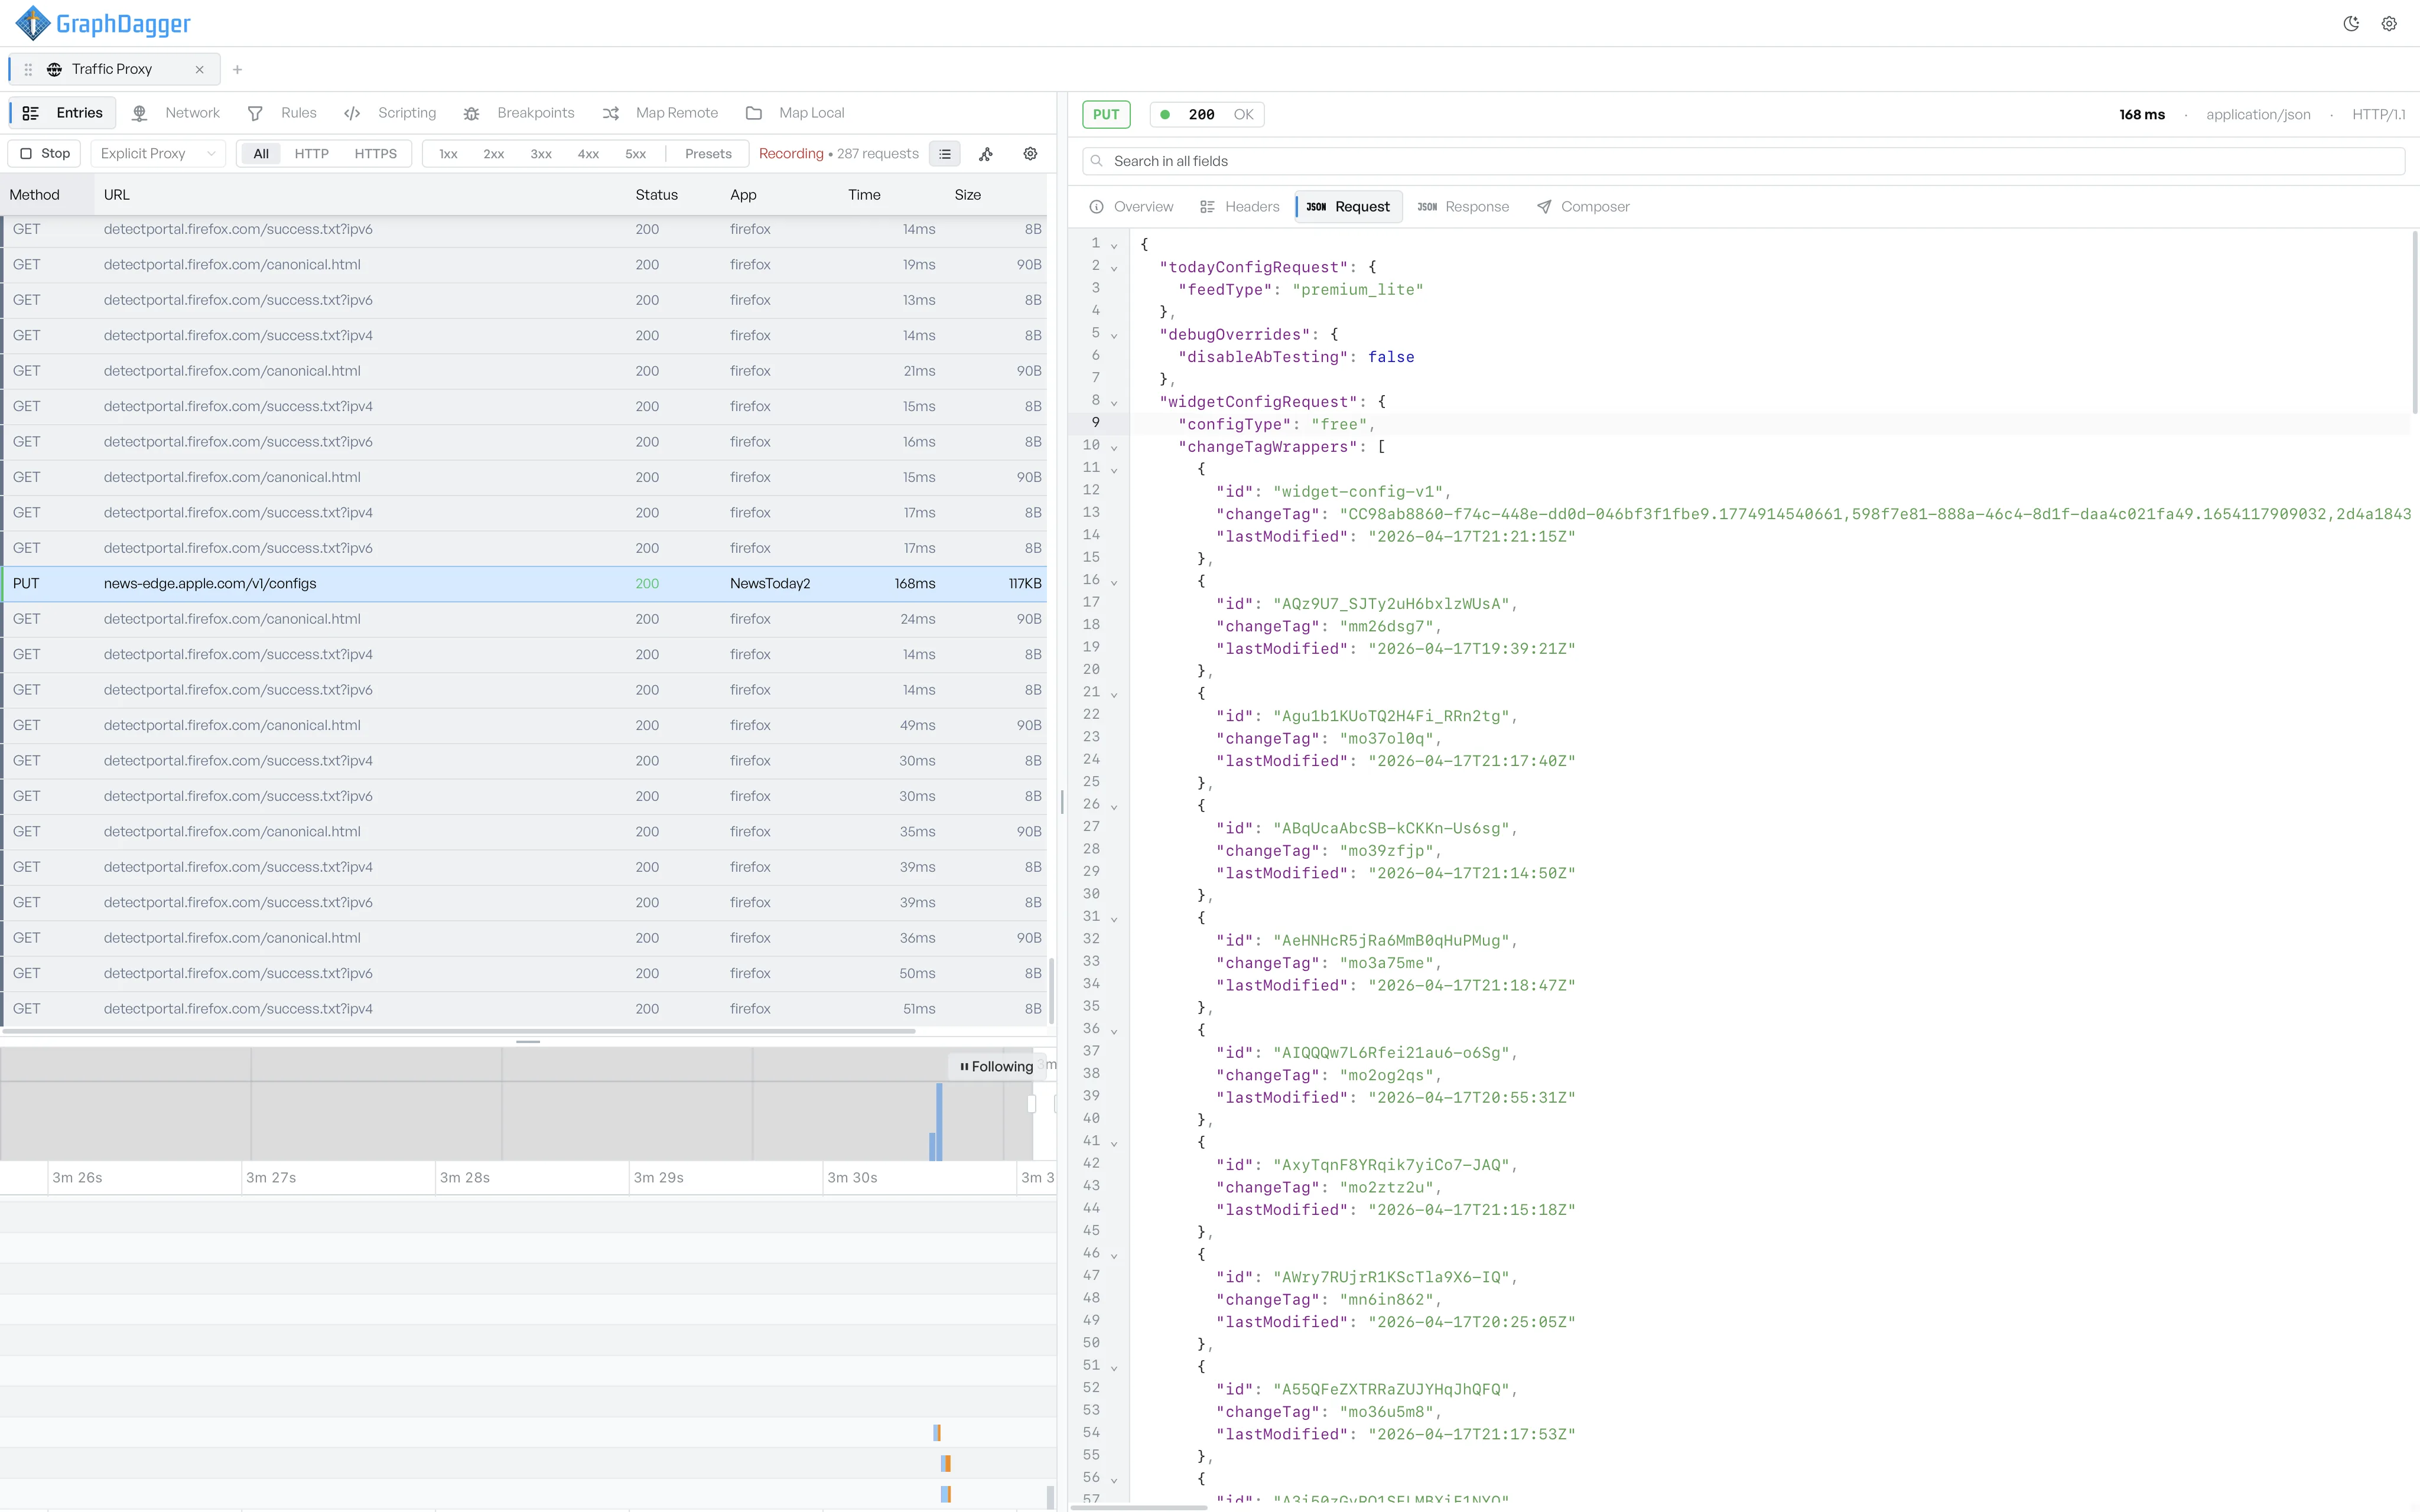
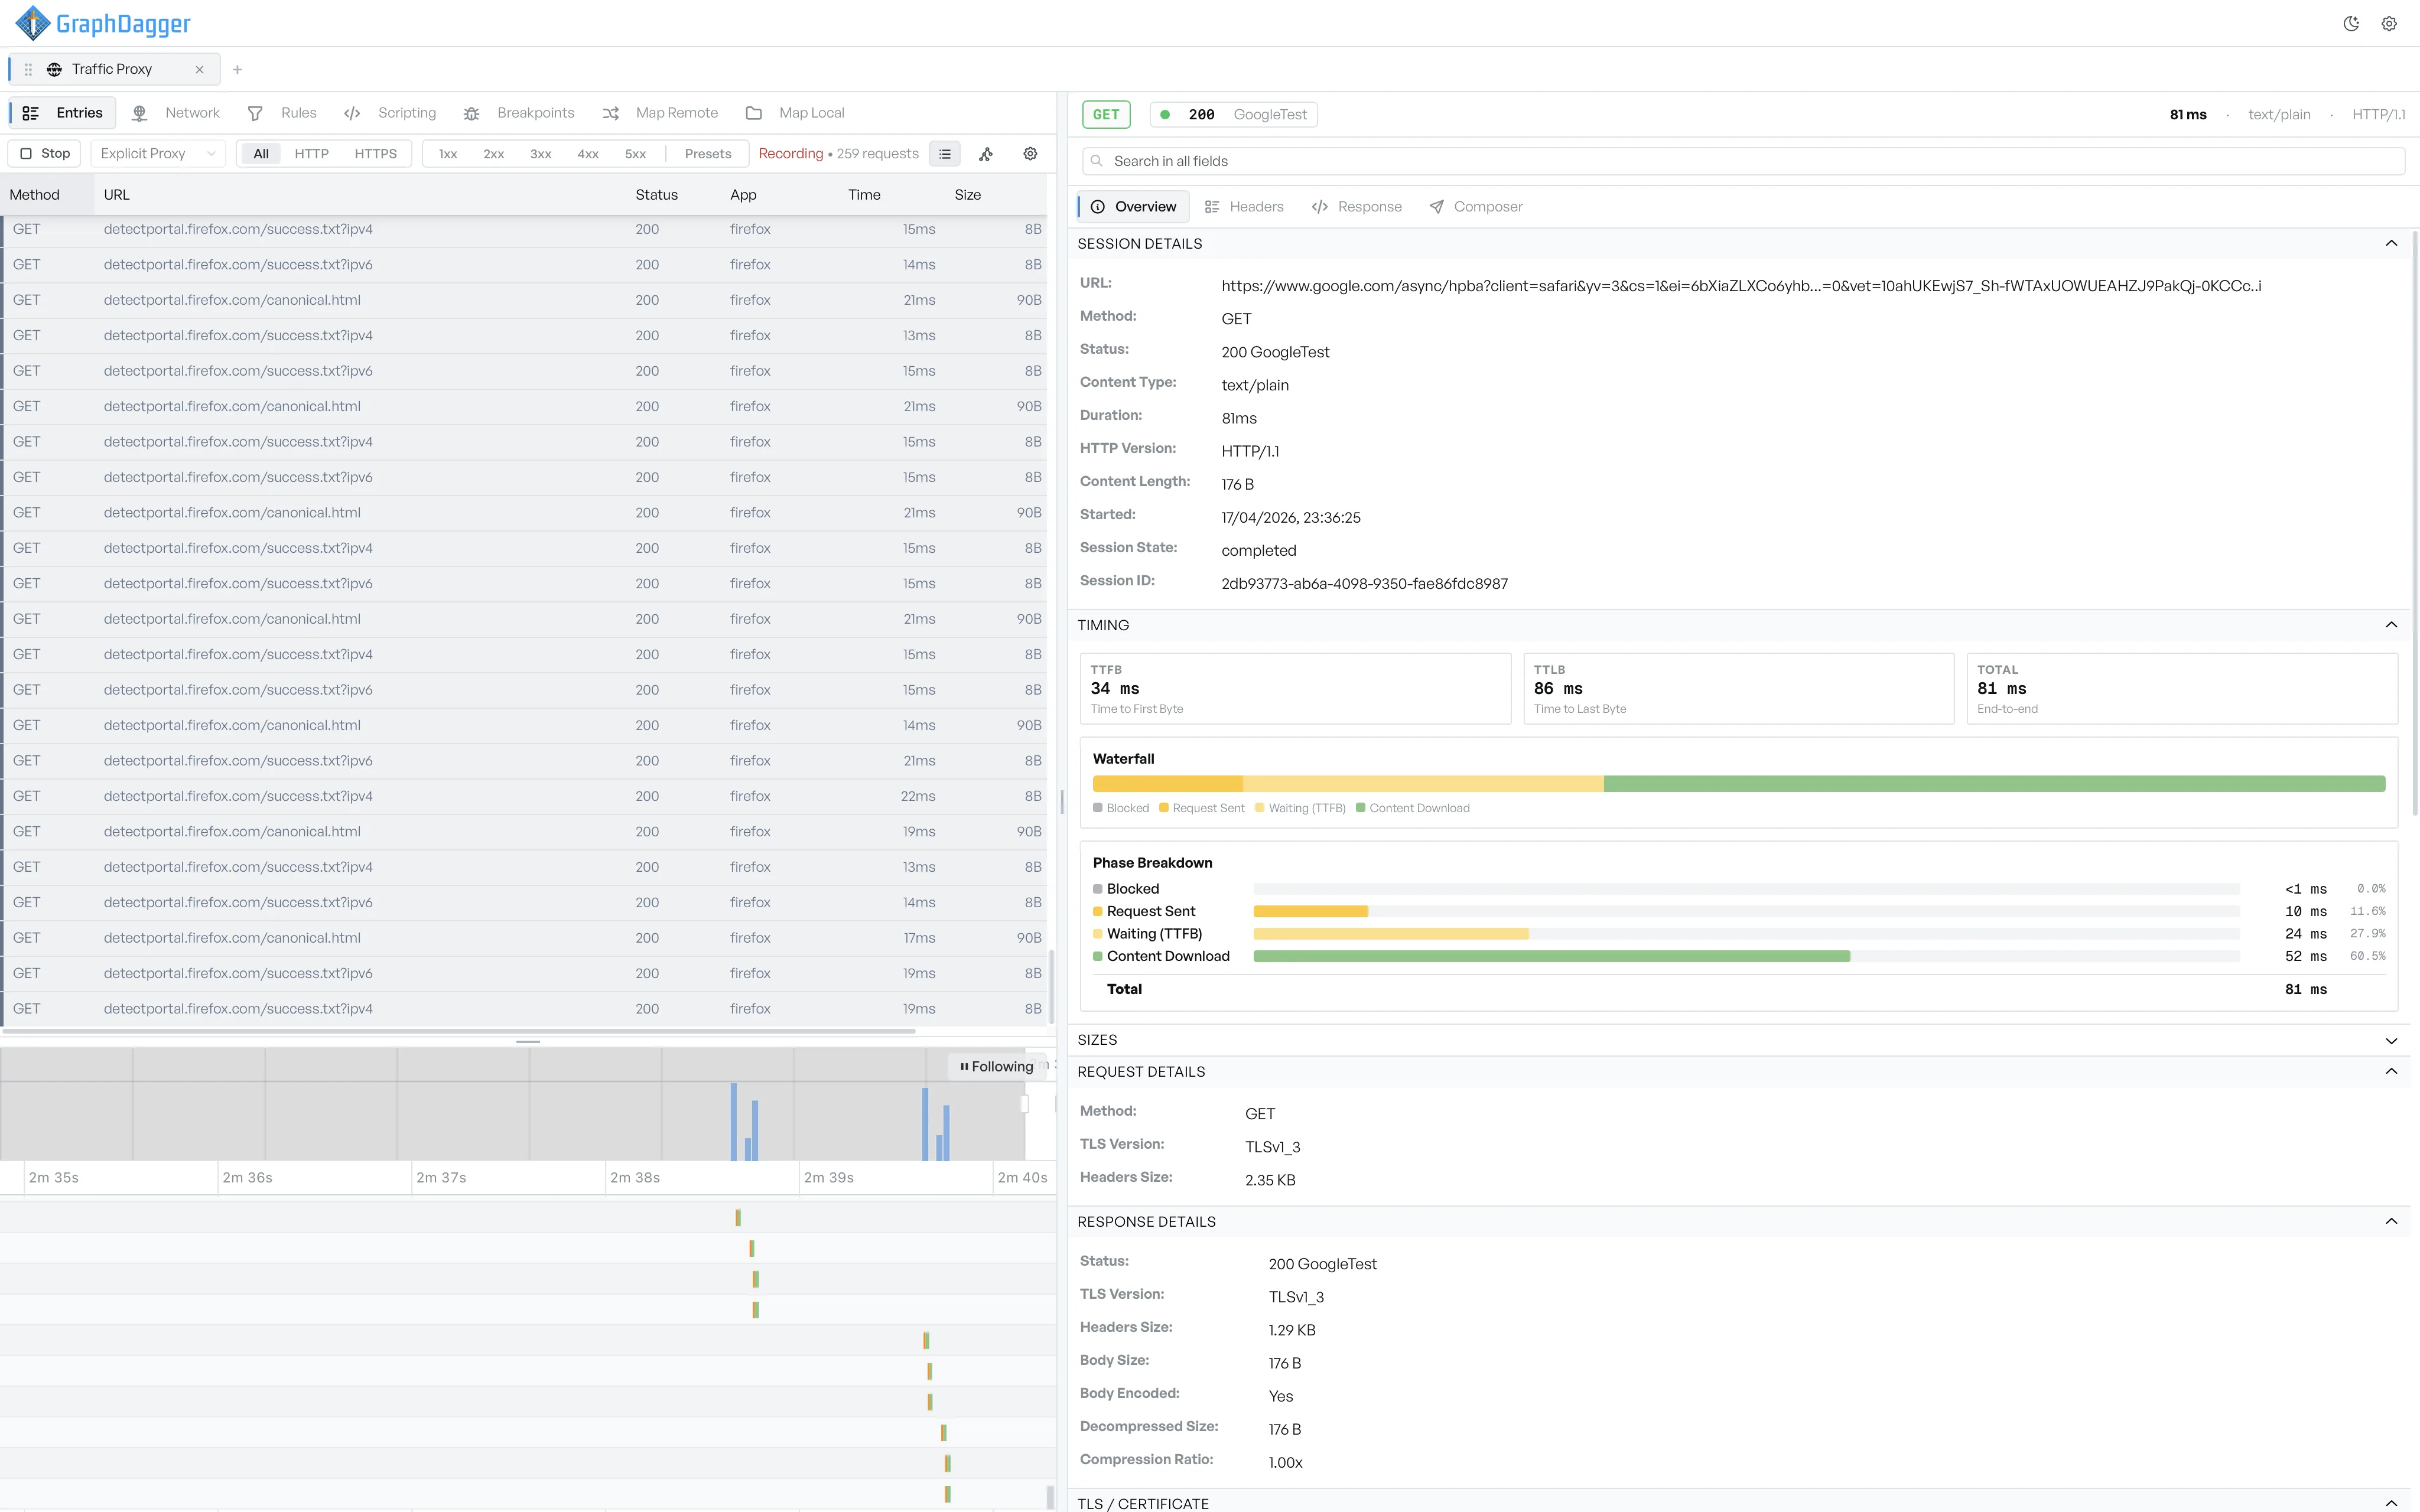
The entries grid lists each request with its method, status, host, path, type, size and duration, and the detail panel opens the rest: a DevTools-style waterfall, per-phase timings and the payloads themselves.
- Sortable grid with per-column filters and quick filters for status class and content type
- Headers, query parameters, cookies and form data as structured tables
- Request and response bodies with syntax highlighting, plus a hex view for binary payloads
- Blocked, DNS, connect, TLS, send, wait and receive phases per request
- Right-click to copy as cURL or as a code snippet in your language
Performance analysis included
The Performance tab reads the whole capture at once, so a slow page explains itself without stepping through requests one by one.
- Page vitals and an error summary per captured page
- Slowest requests and largest responses, ranked
- Caching behaviour and redirect chains computed from the capture
How to capture a HAR file
Every major browser exports a HAR from its developer tools. Reproduce the problem with the Network tab open, then save the log.
| Browser | Steps |
|---|---|
| Chrome and Edge | Press F12, open the Network tab, tick Preserve log, reload and reproduce the problem, then right-click a request and choose Save all as HAR with content. |
| Firefox | Press F12, open the Network tab, reproduce the problem, then click the settings icon at the right of the toolbar and choose Save All As HAR. |
| Safari | Enable the Develop menu in Settings, Advanced. Open Web Inspector, choose the Network tab, reproduce the problem, then click Export. |
What the desktop app adds
A browser tab cannot run a man-in-the-middle proxy or the native analysis engine. Those halves of the Web Debugger live in the GraphDagger desktop app.
- Live capture through GraphDagger's own proxy instead of importing a file after the fact
- Breakpoints to pause and edit a request mid-flight, and rules that rewrite traffic automatically
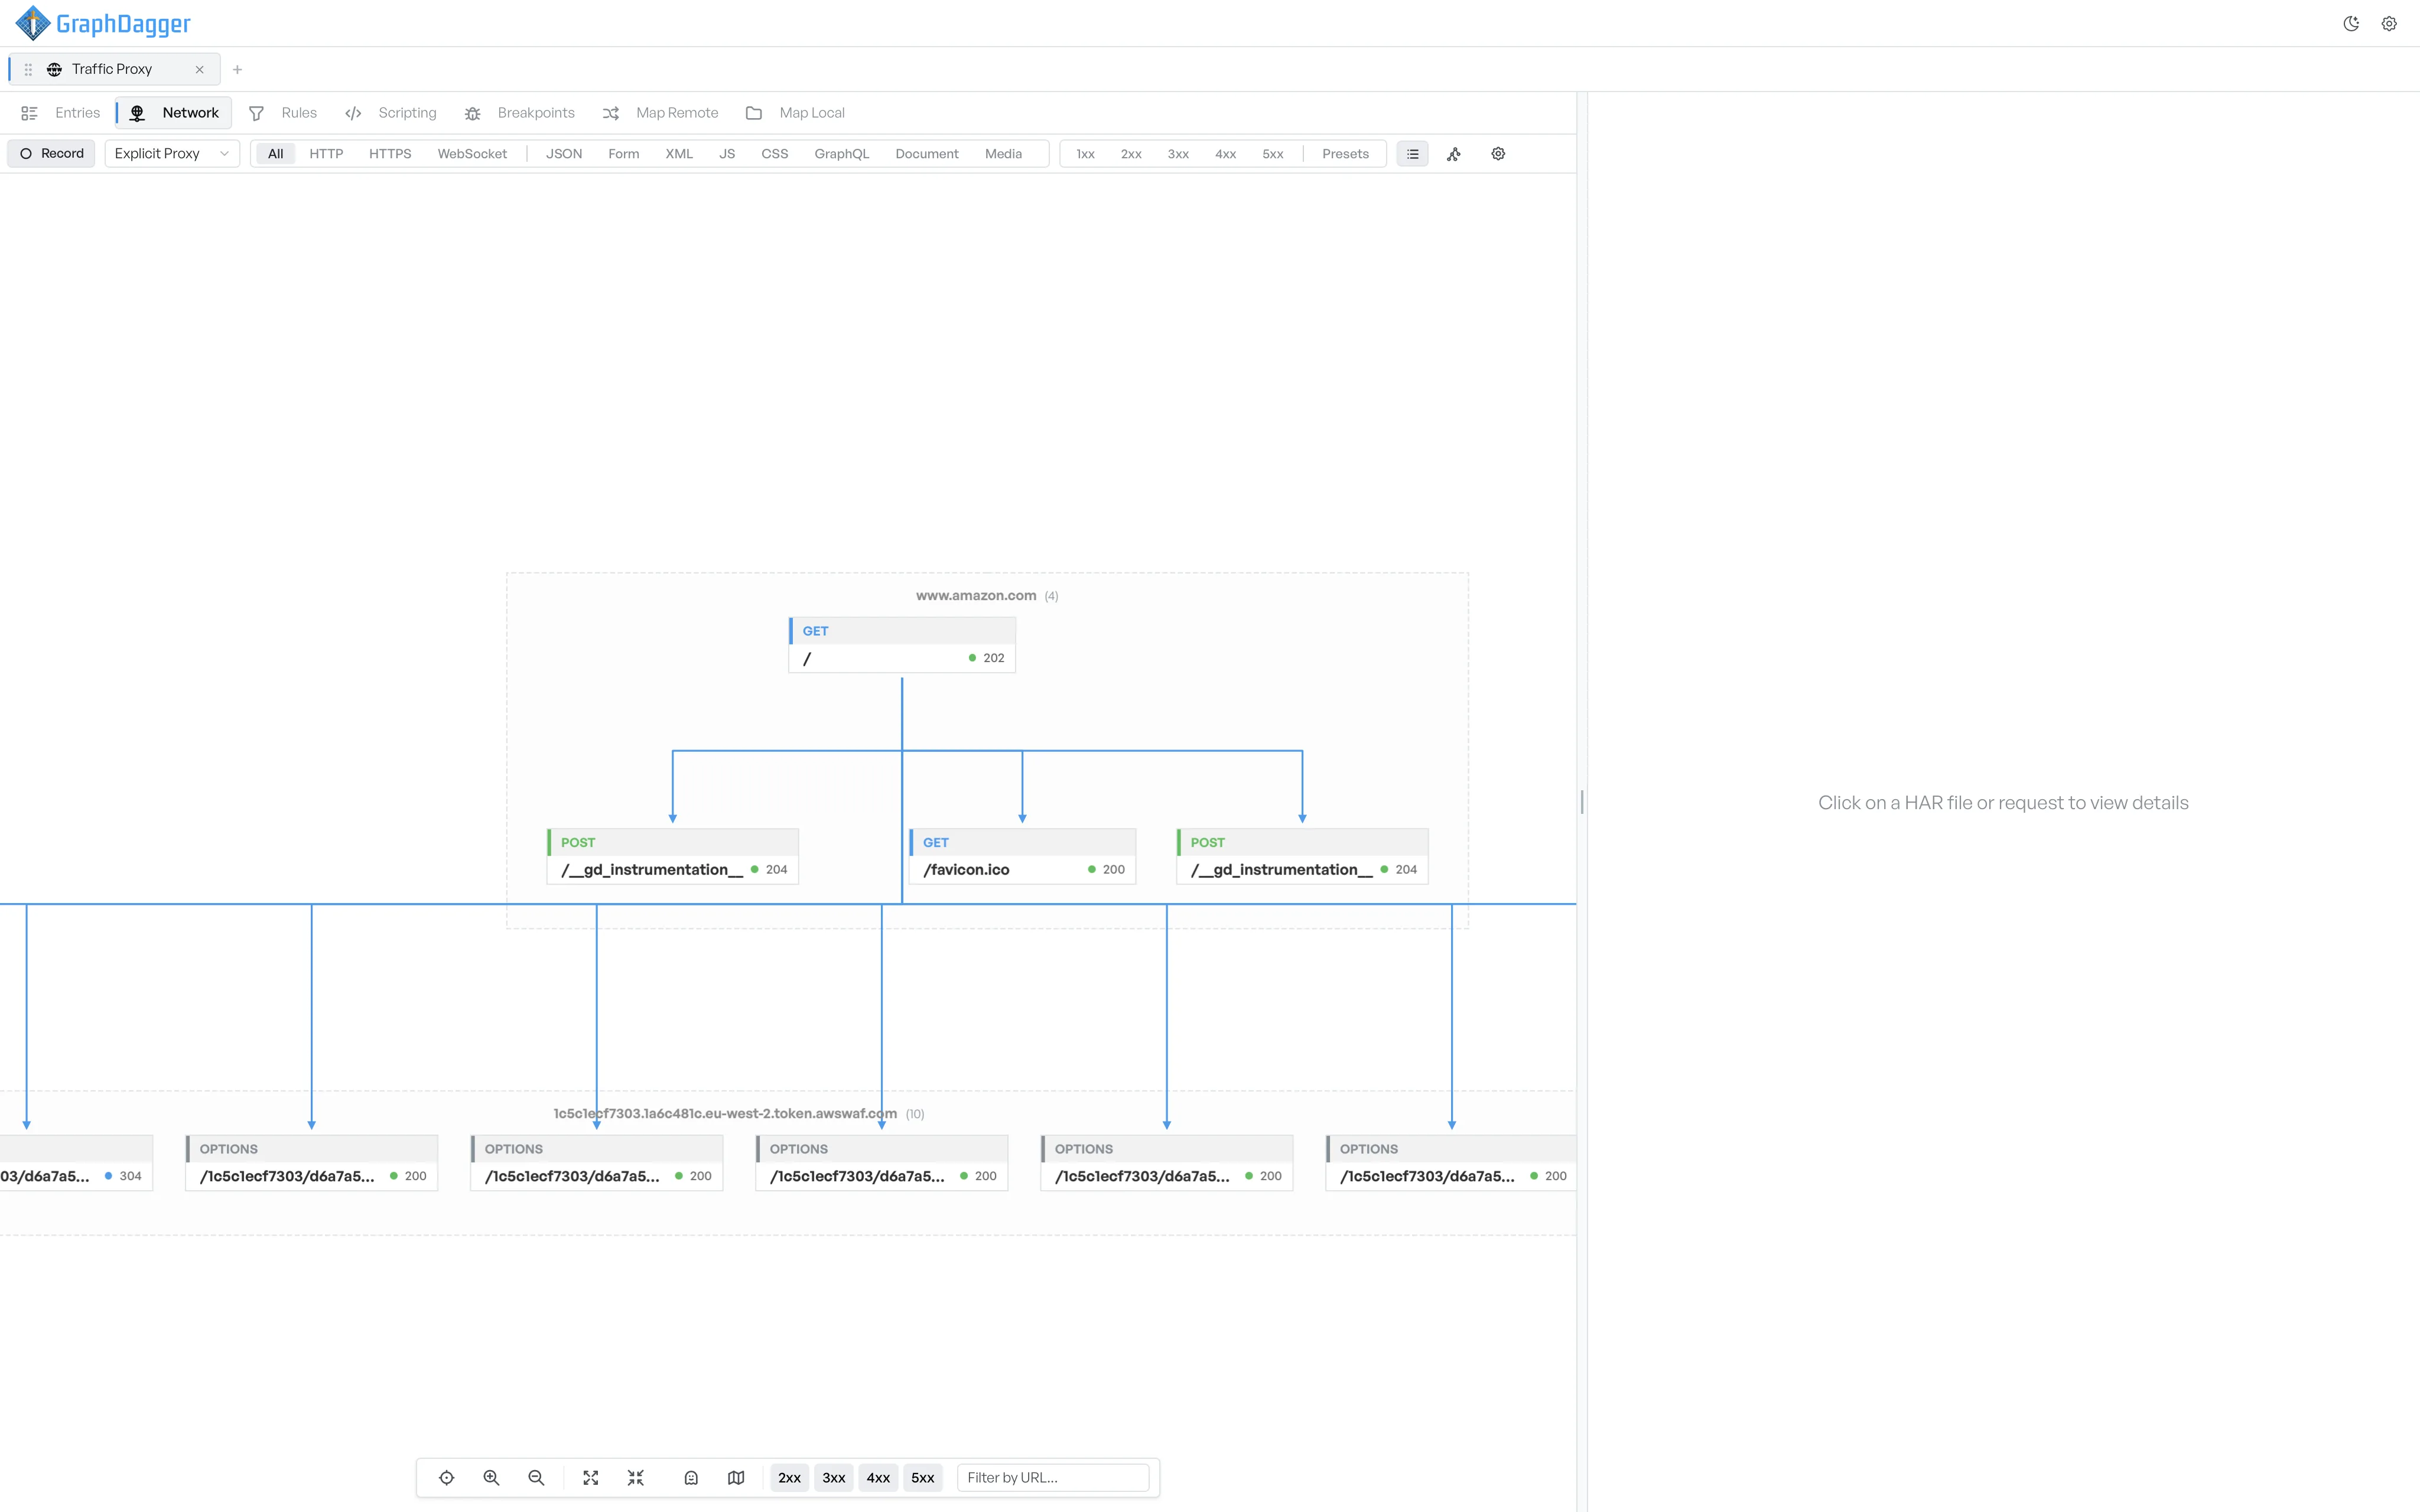
- The network dependency graph, built natively from the whole capture
- Fiddler .saz and Proxyman captures opened alongside HAR, with side-by-side session comparison
14 days, every tool unlocked. macOS and Windows.