Web Debugger
Inspect and modify HTTP traffic: breakpoints, proxy rules, a scripting engine and full request and response inspection.
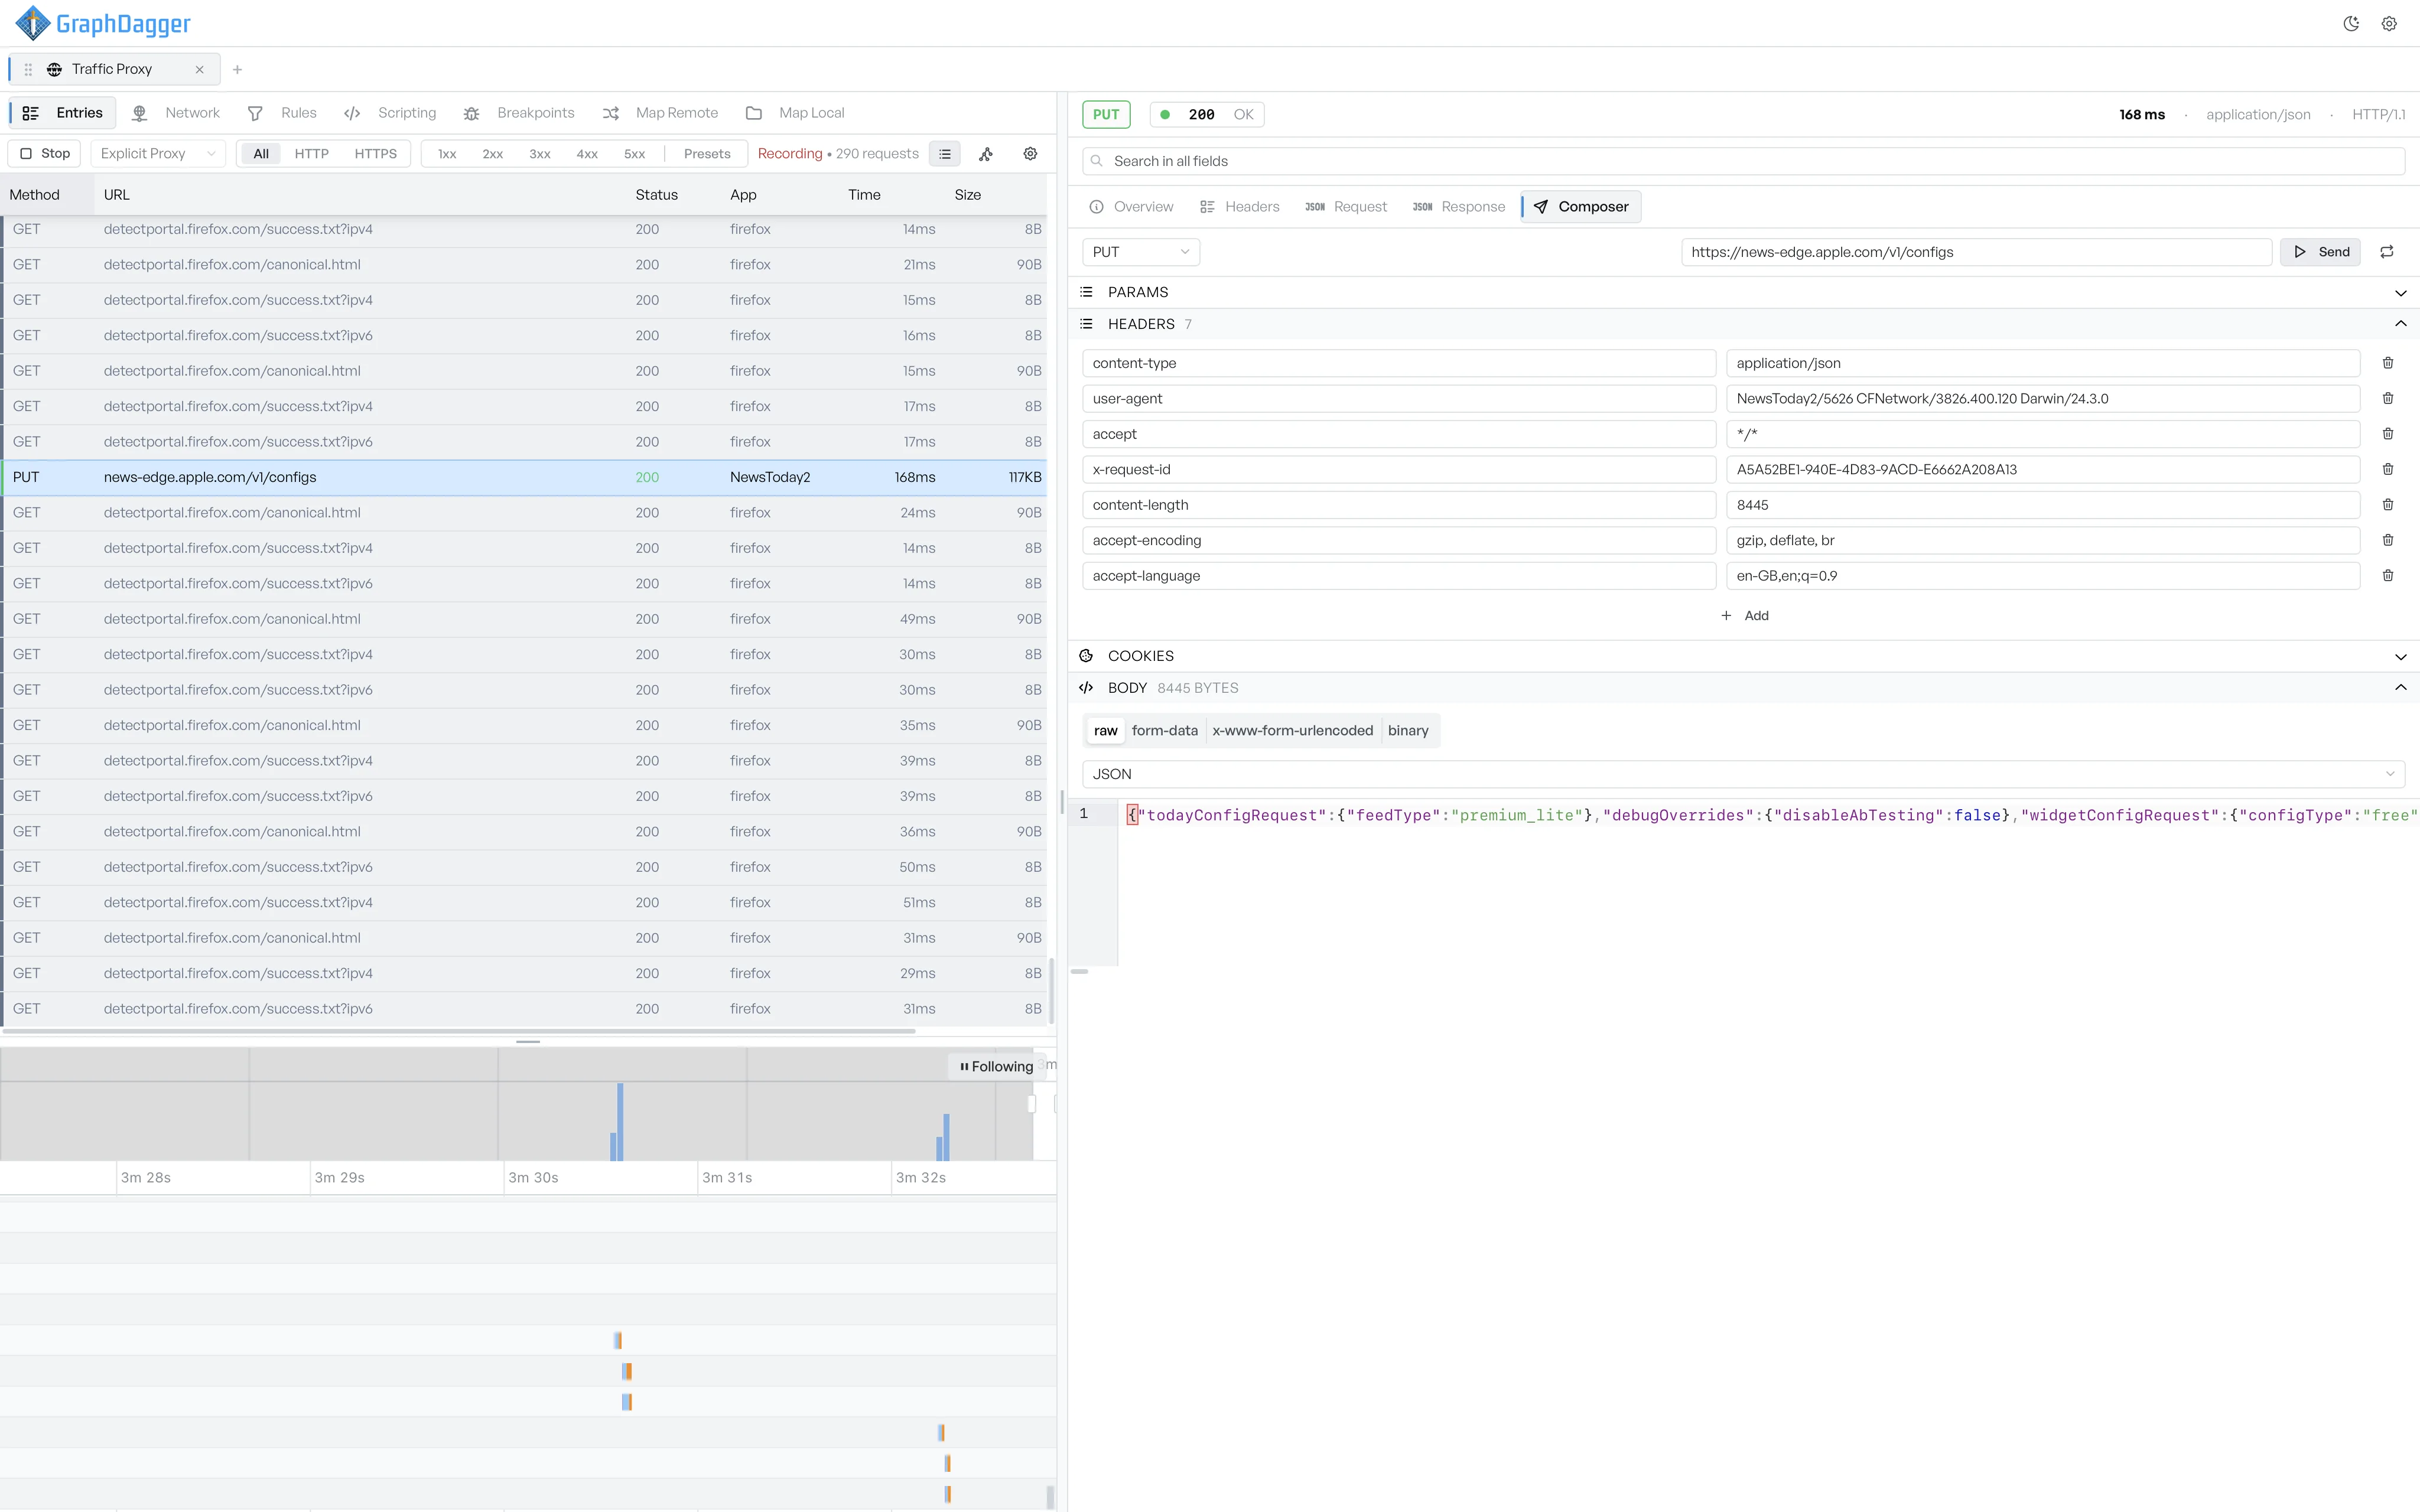
Intercept and inspect HTTP traffic
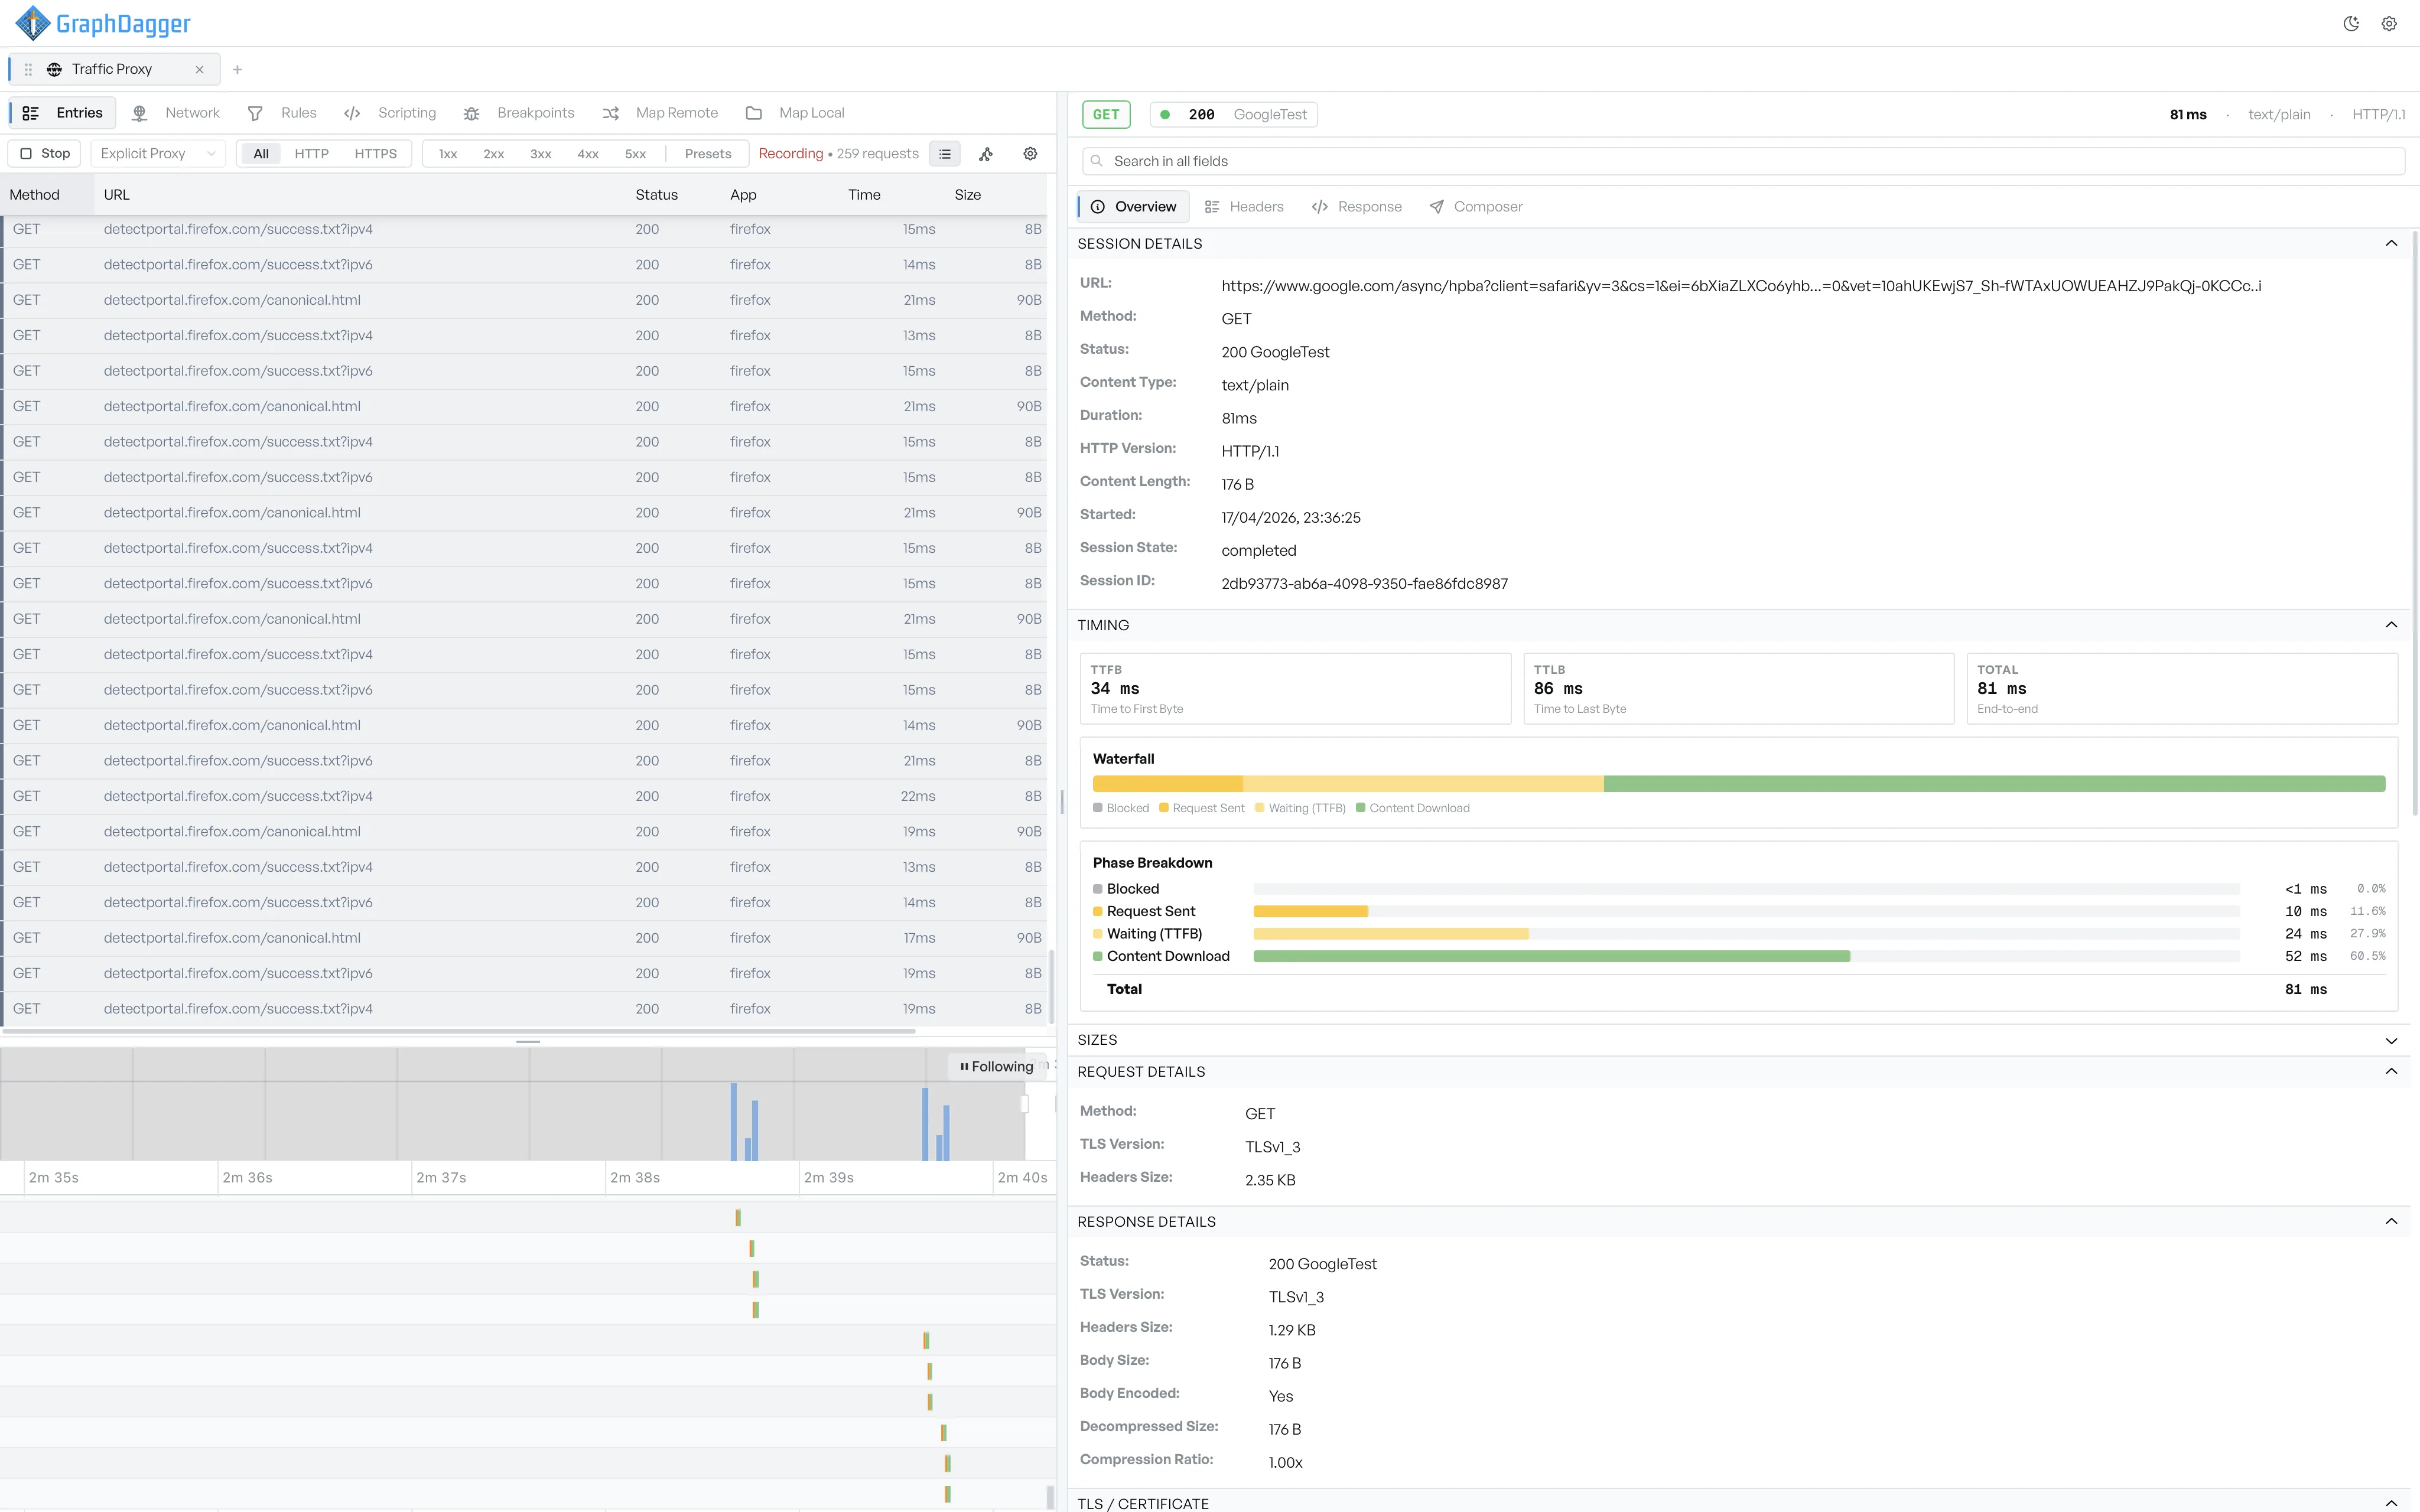
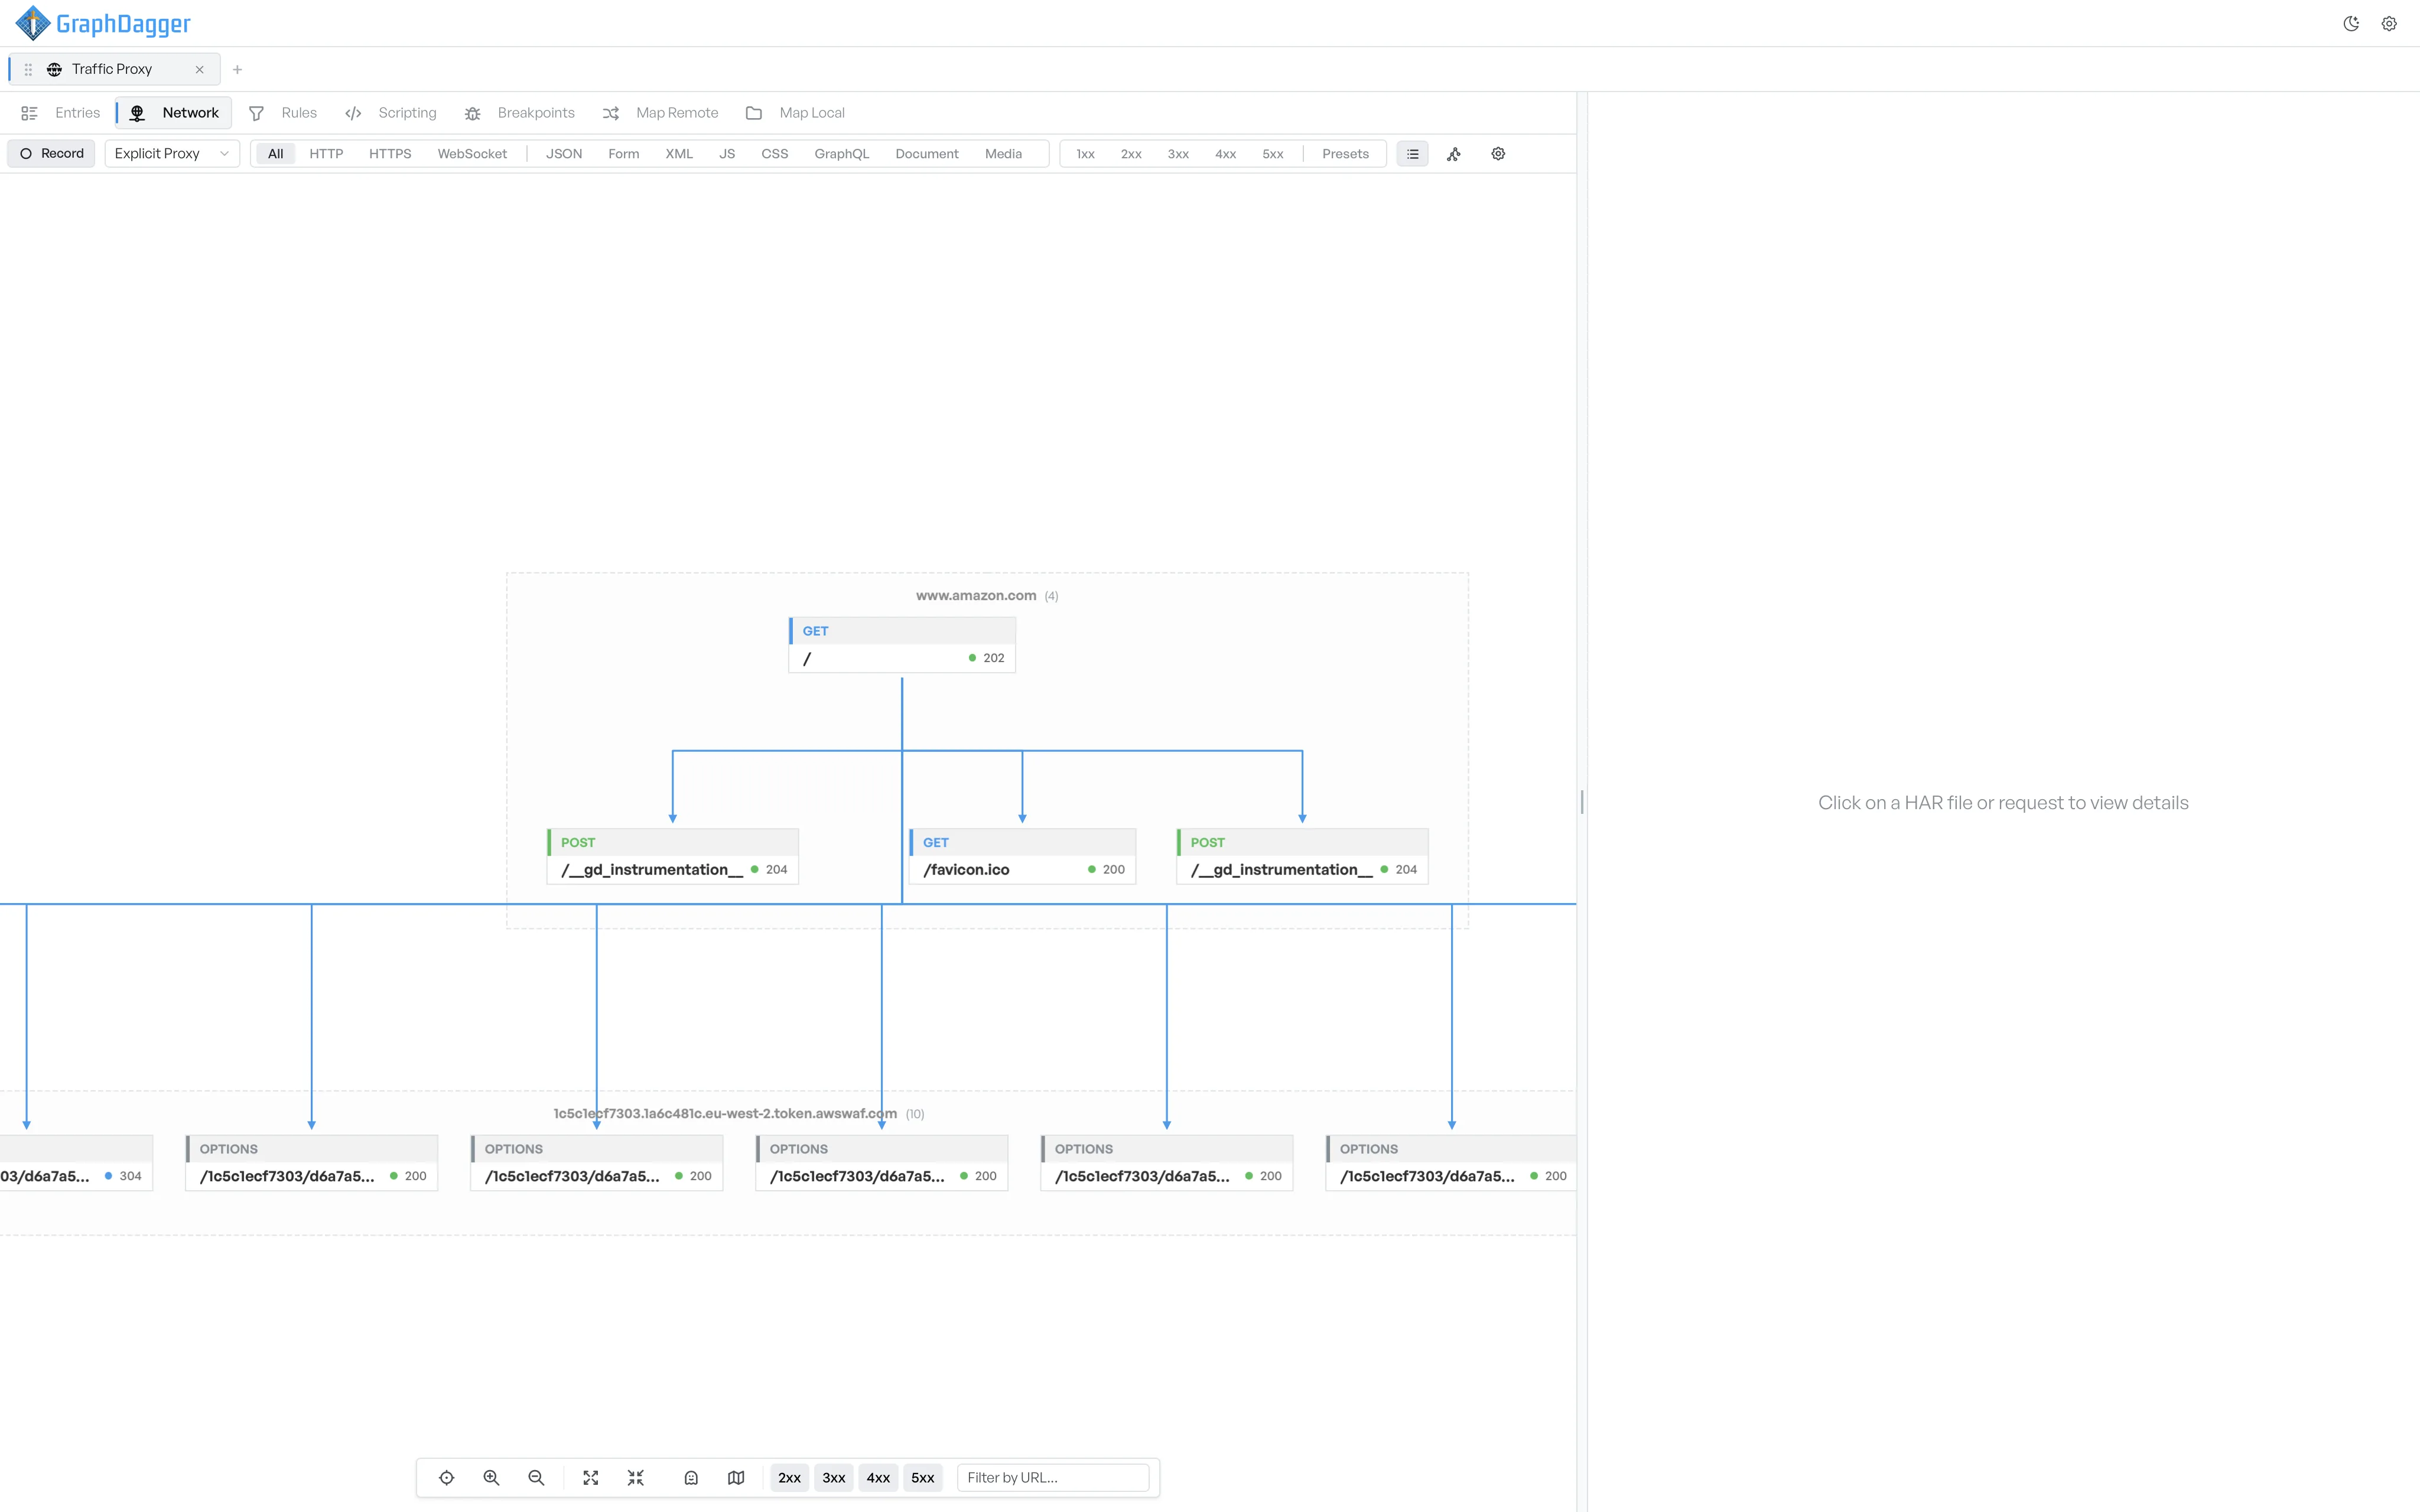
Record HTTP, HTTPS and WebSocket traffic as it flows through the proxy. Every entry lands in a colour-coded list with status, timing and size, above a waterfall of the whole session. Select a row and the inspector breaks it down: headers, body, per-host request counts, and a phase-by-phase timing breakdown from DNS lookup to content download.
- Live capture of HTTP, HTTPS and WebSocket traffic
- Session waterfall with per-request timing phases
- Roll-ups by host, status code and content type
Performance analysis across the session
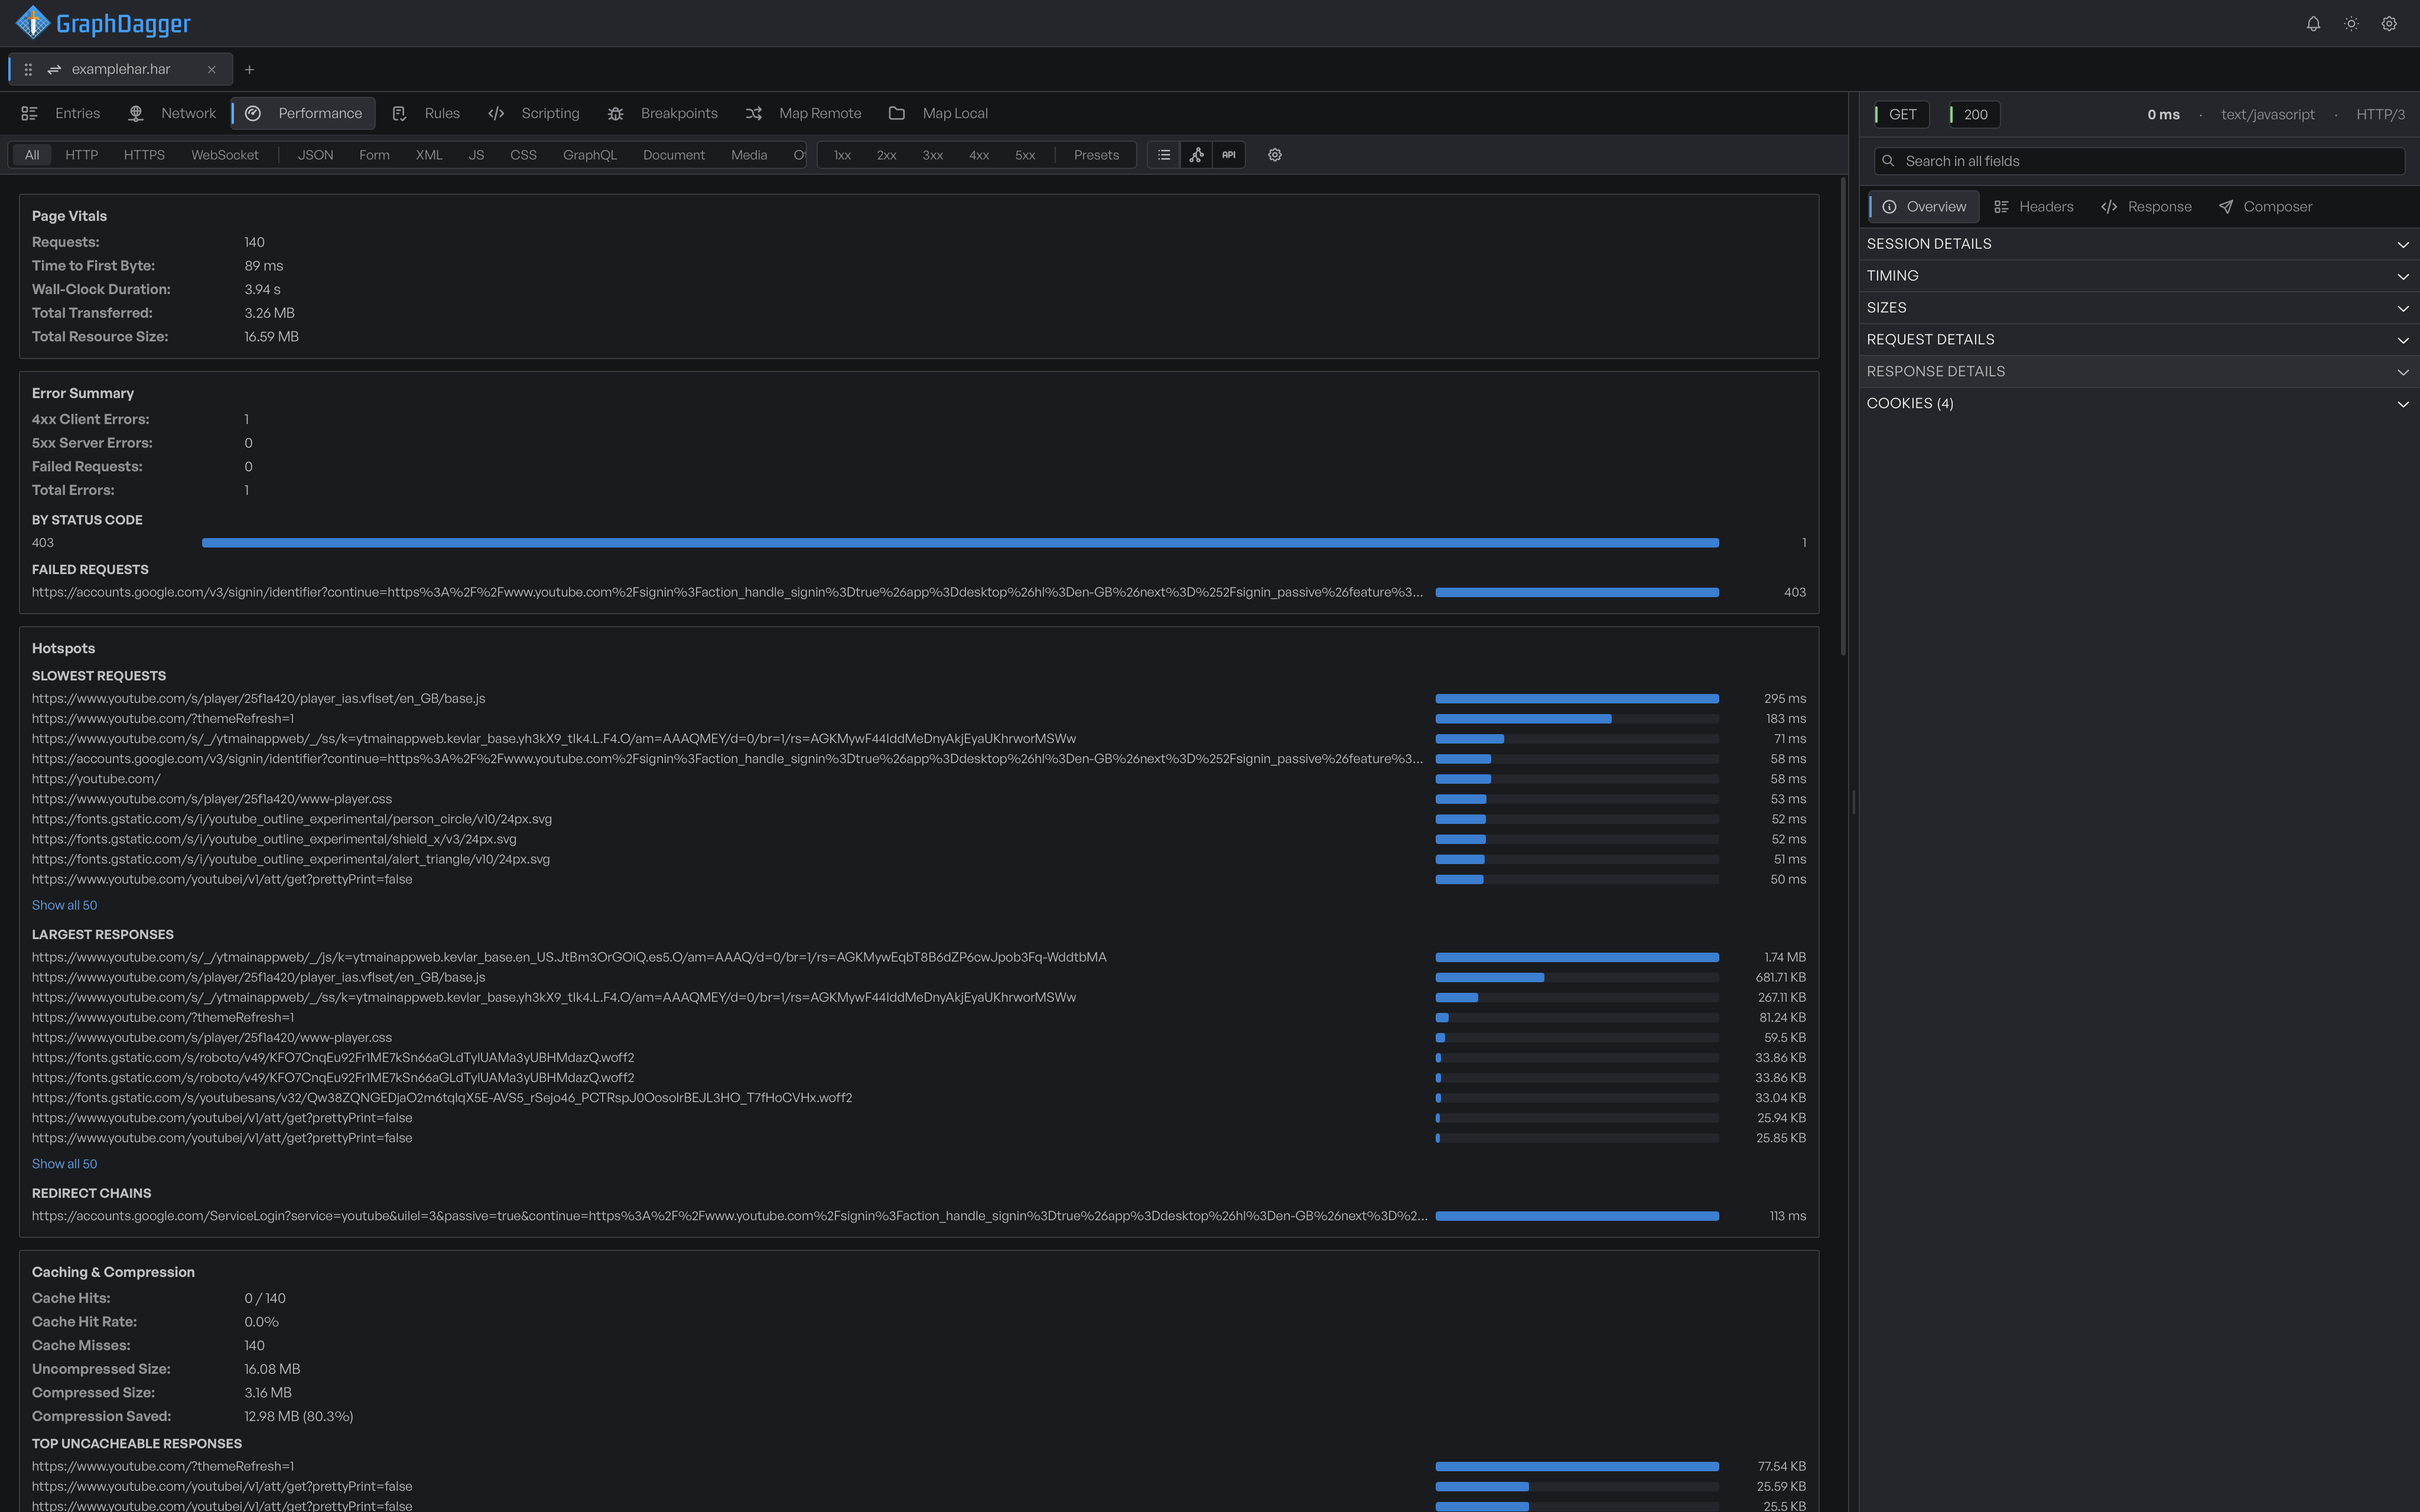
The Performance tab rolls the whole session into one read: Page Vitals for request count, time to first byte and total weight, an error summary of 4xx, 5xx and failed requests, and hotspot lists of the slowest requests, largest responses and redirect chains. Every row is clickable and opens the request behind the number. It works for live recordings and imported HAR files alike.
- Page vitals, error summary and hotspot lists
- Caching, compression and third-party weight breakdowns
- Click any metric to open the request behind it
Rewrite traffic automatically with rules
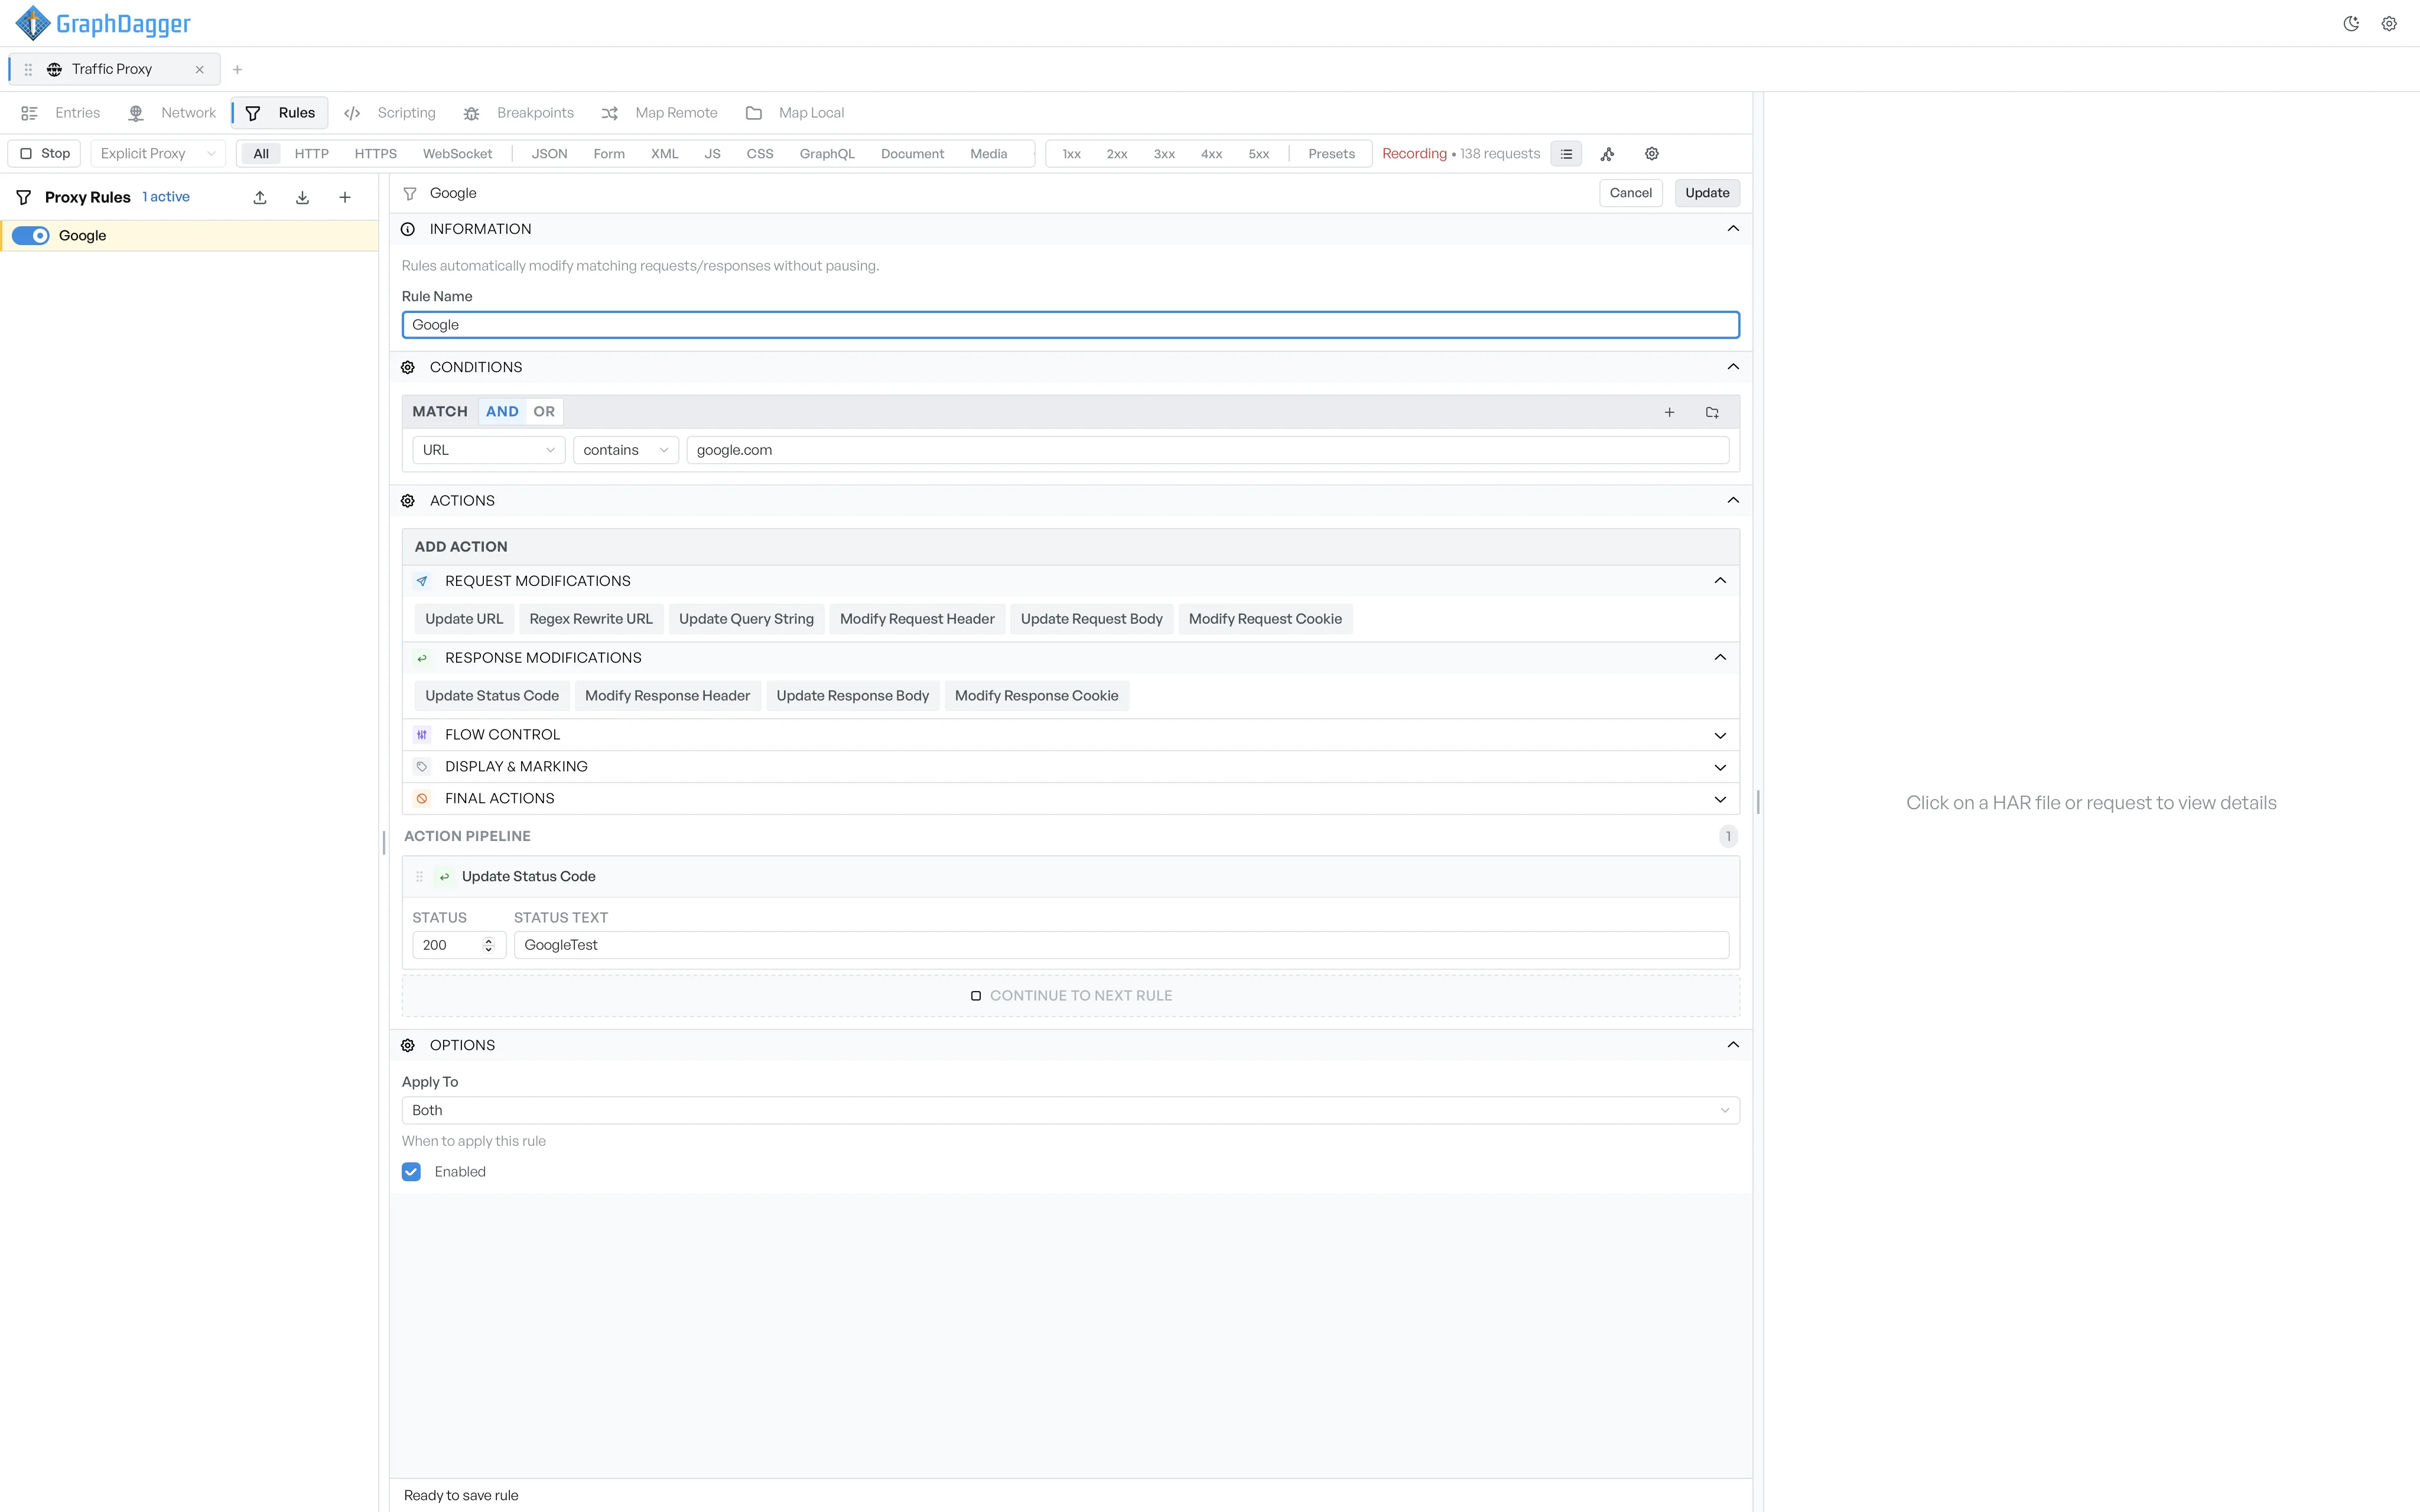
Rules modify matching requests and responses without pausing anything: strip a header on every call, rewrite a status code for a host, or return a canned response for an endpoint. Match conditions combine with AND and OR, and the actions you pick stack into an ordered pipeline drawn from five categories: request modifications, response modifications, flow control, display and marking, and final actions.
- Match conditions combined with AND and OR
- Actions for URLs, headers, bodies, cookies and status codes
- Delays, bandwidth throttling and triggered breakpoints
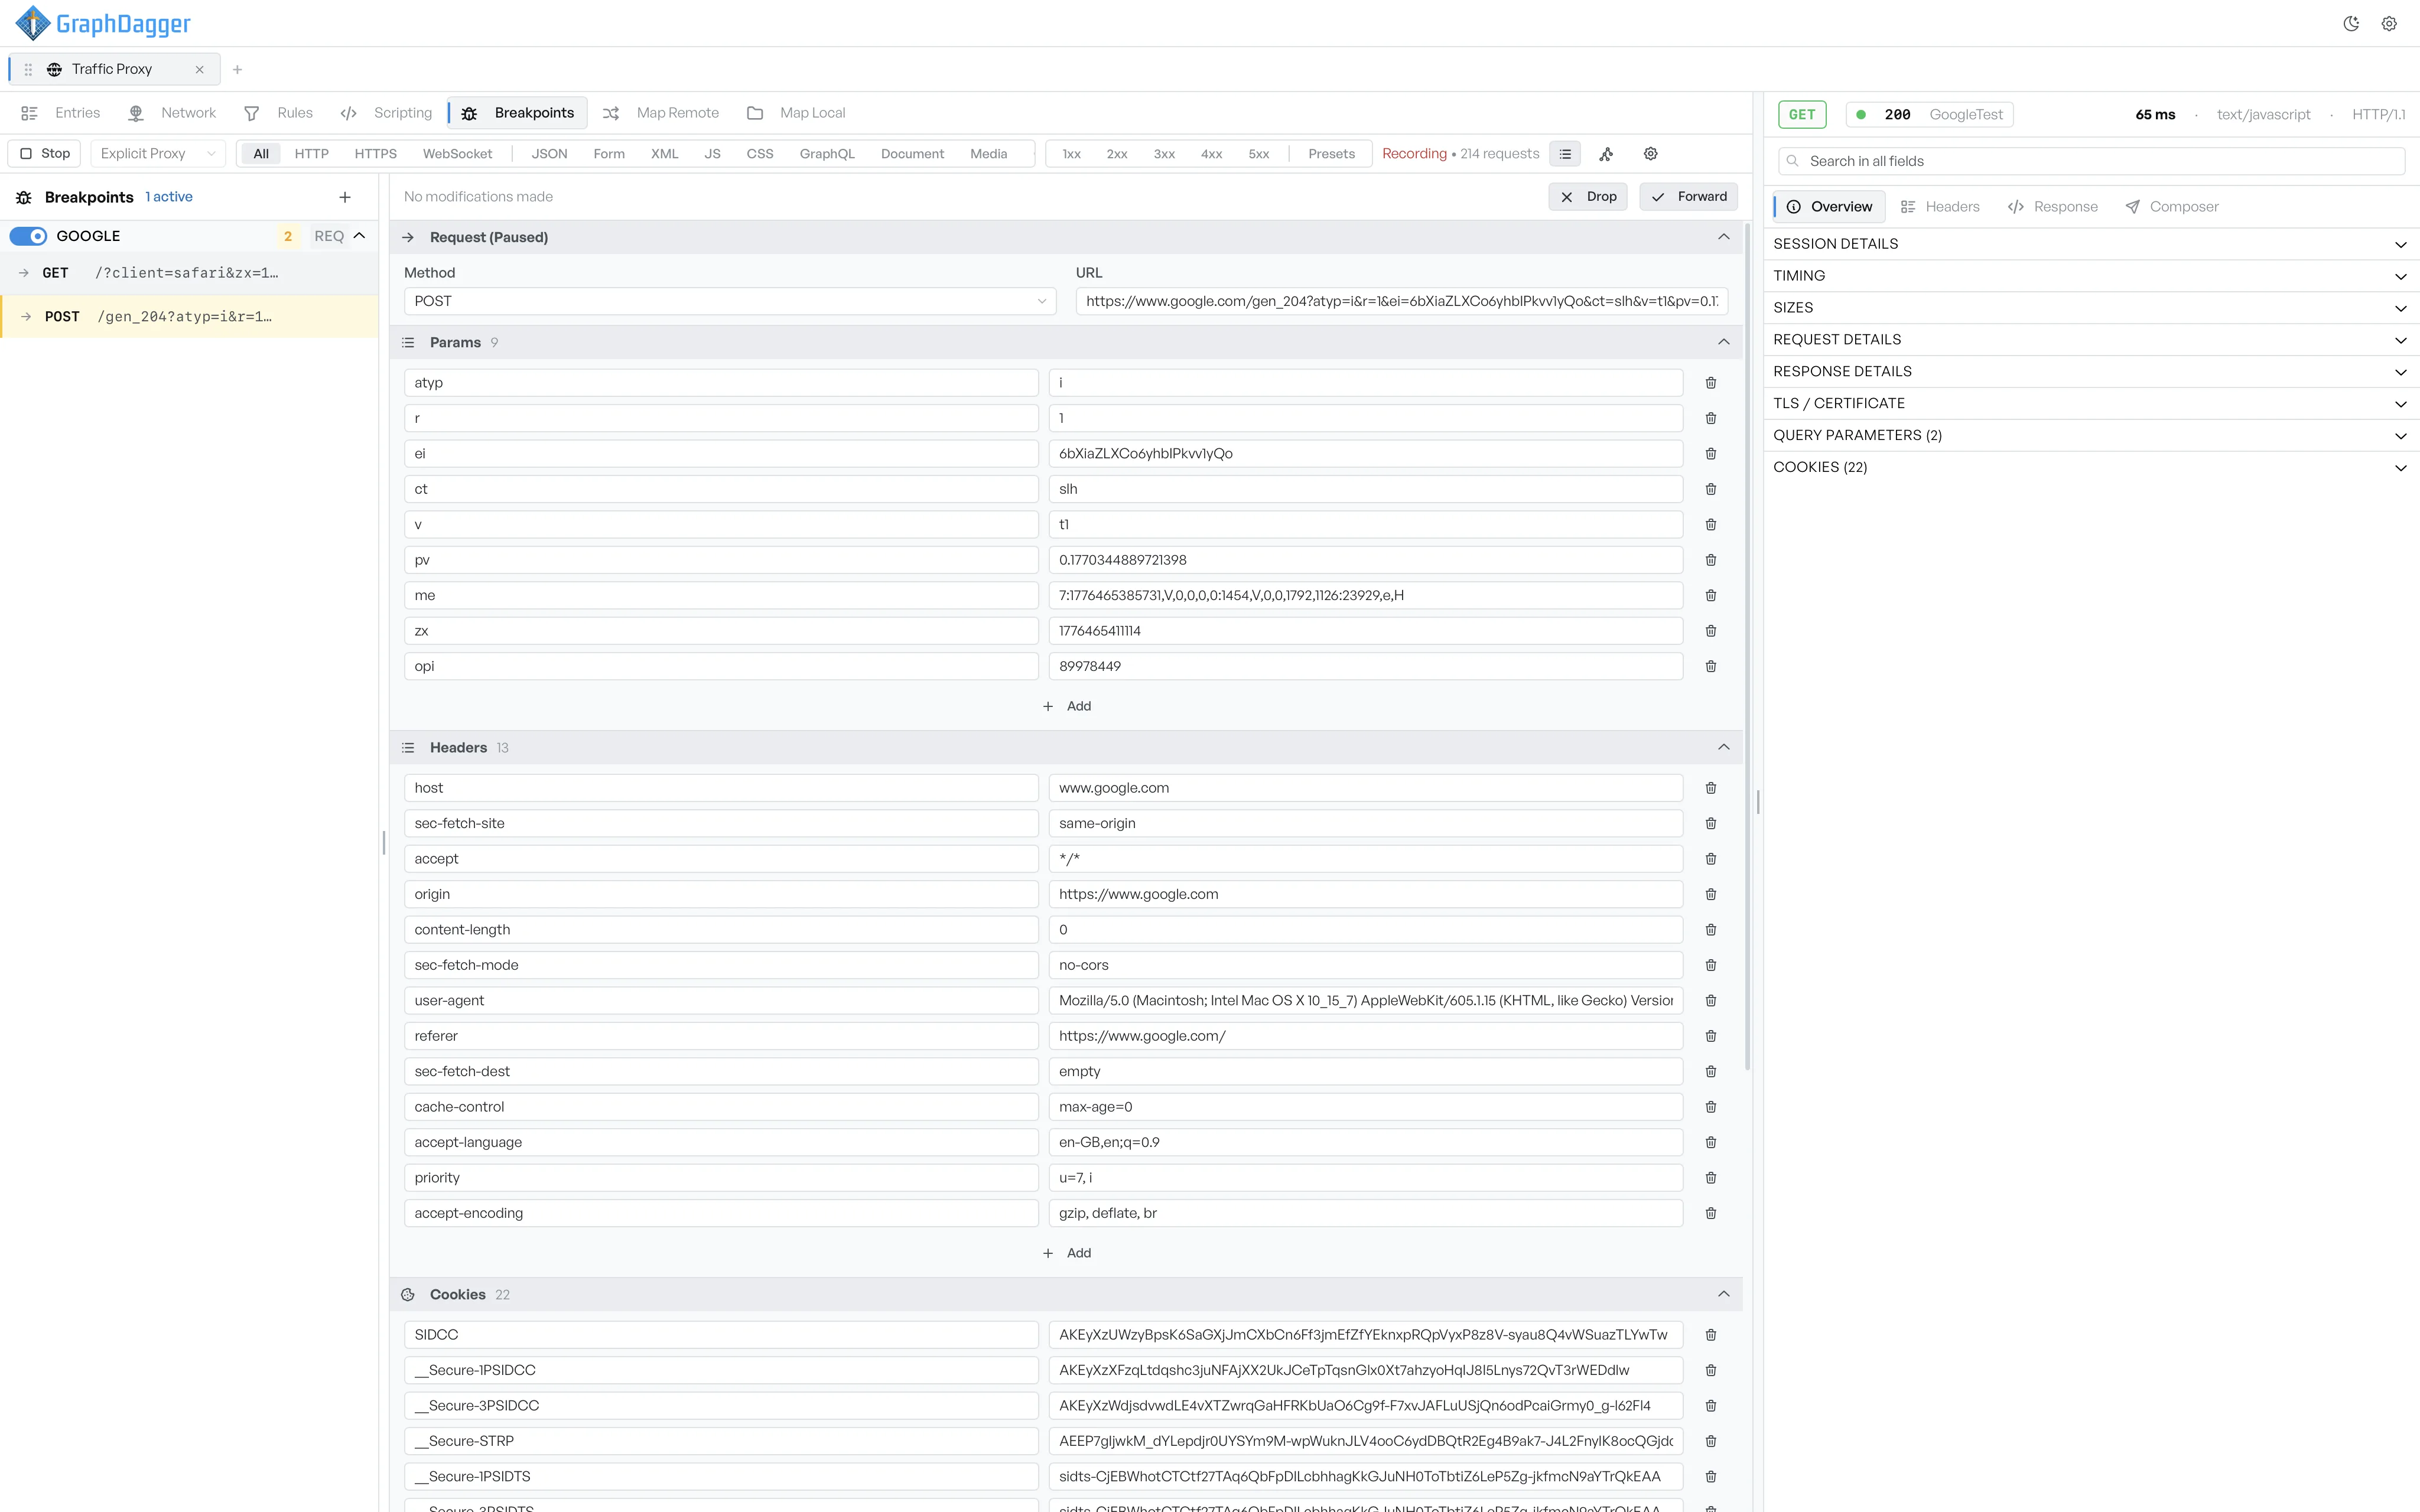
Pause and edit requests with breakpoints
A breakpoint holds a matching request on the wire before it reaches the server, or a response before it reaches the client. The paused exchange opens as editable rows for params, headers, cookies and body, and once you change anything the Forward button switches to Forward Modified, so it is always clear whether the original or your version goes out. Drop discards the request entirely.
- Pause before the request or after the response
- Edit params, headers, cookies and body inline
- Forward the original, forward your changes, or drop it
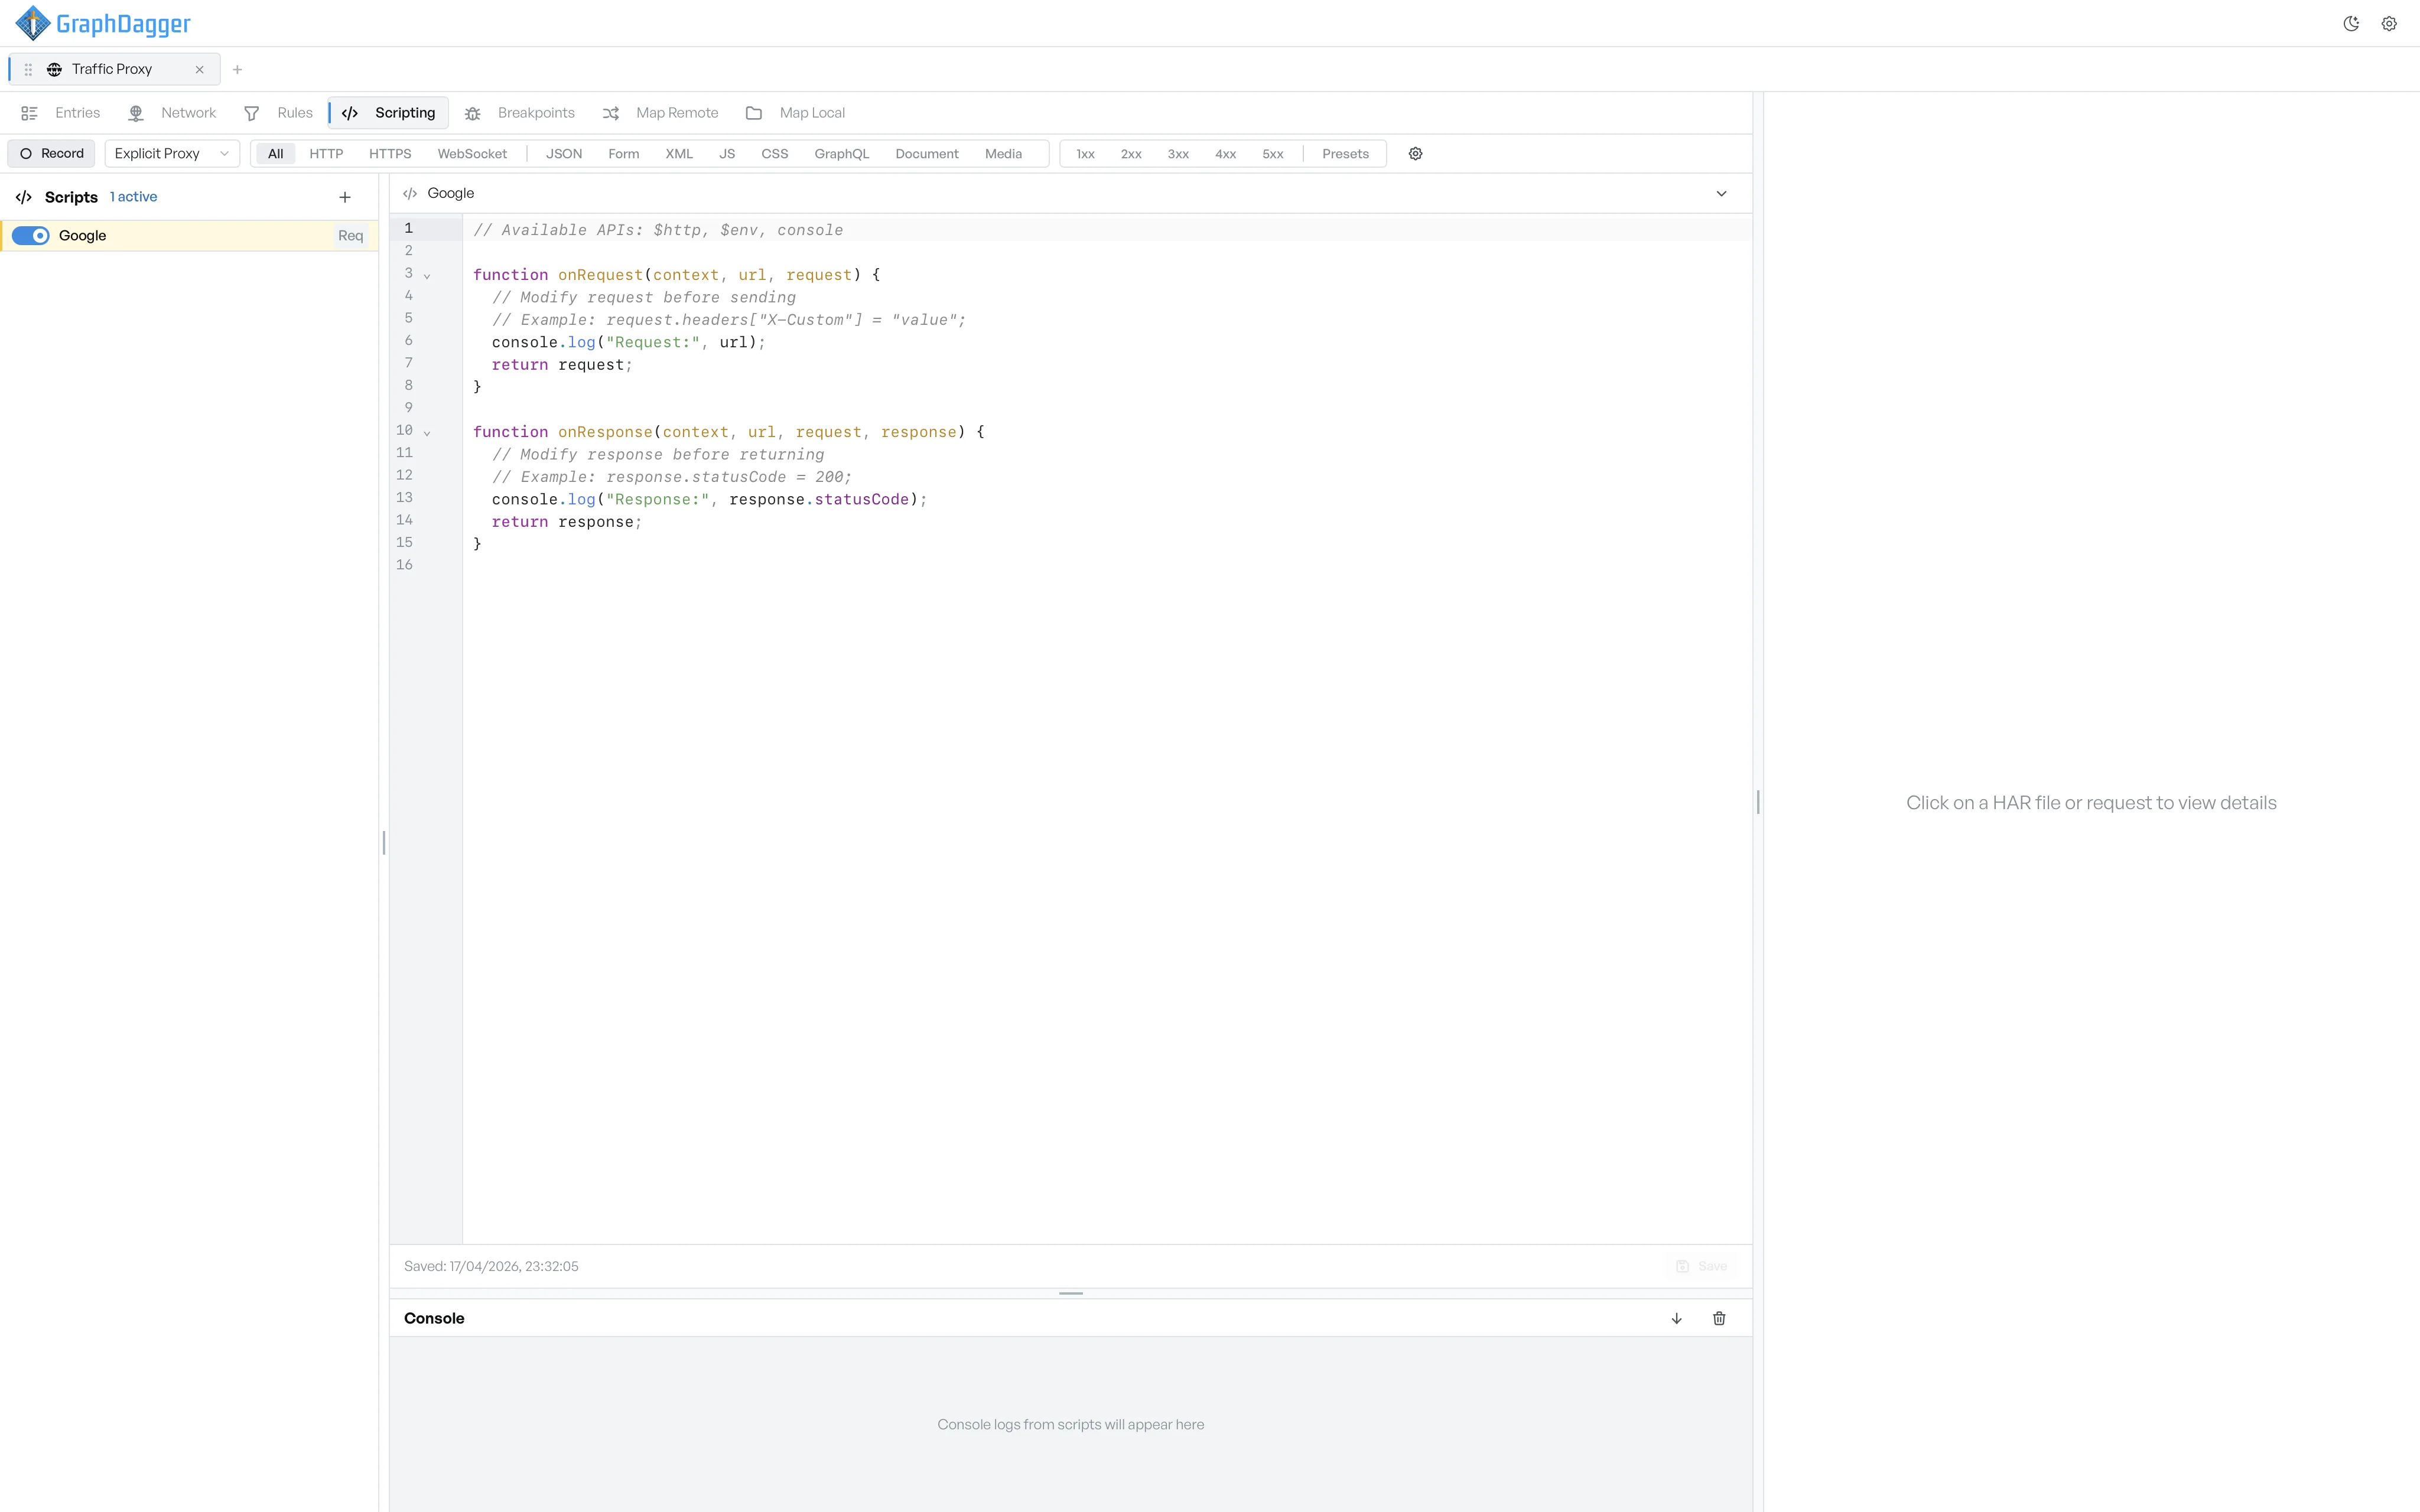
Script the proxy in JavaScript
When rules cannot express the logic, write it. A script declares onRequest and onResponse functions that run on matched traffic, in an editor with syntax highlighting and autocomplete for the built-in APIs. Return the modified object and the proxy uses your version from that point on, while the console panel underneath streams whatever the script logs as traffic flows.
- onRequest and onResponse hooks on matched traffic
- $http, $env and console APIs built in
- Live console output as scripts run
Capture from browsers, terminals and remote devices
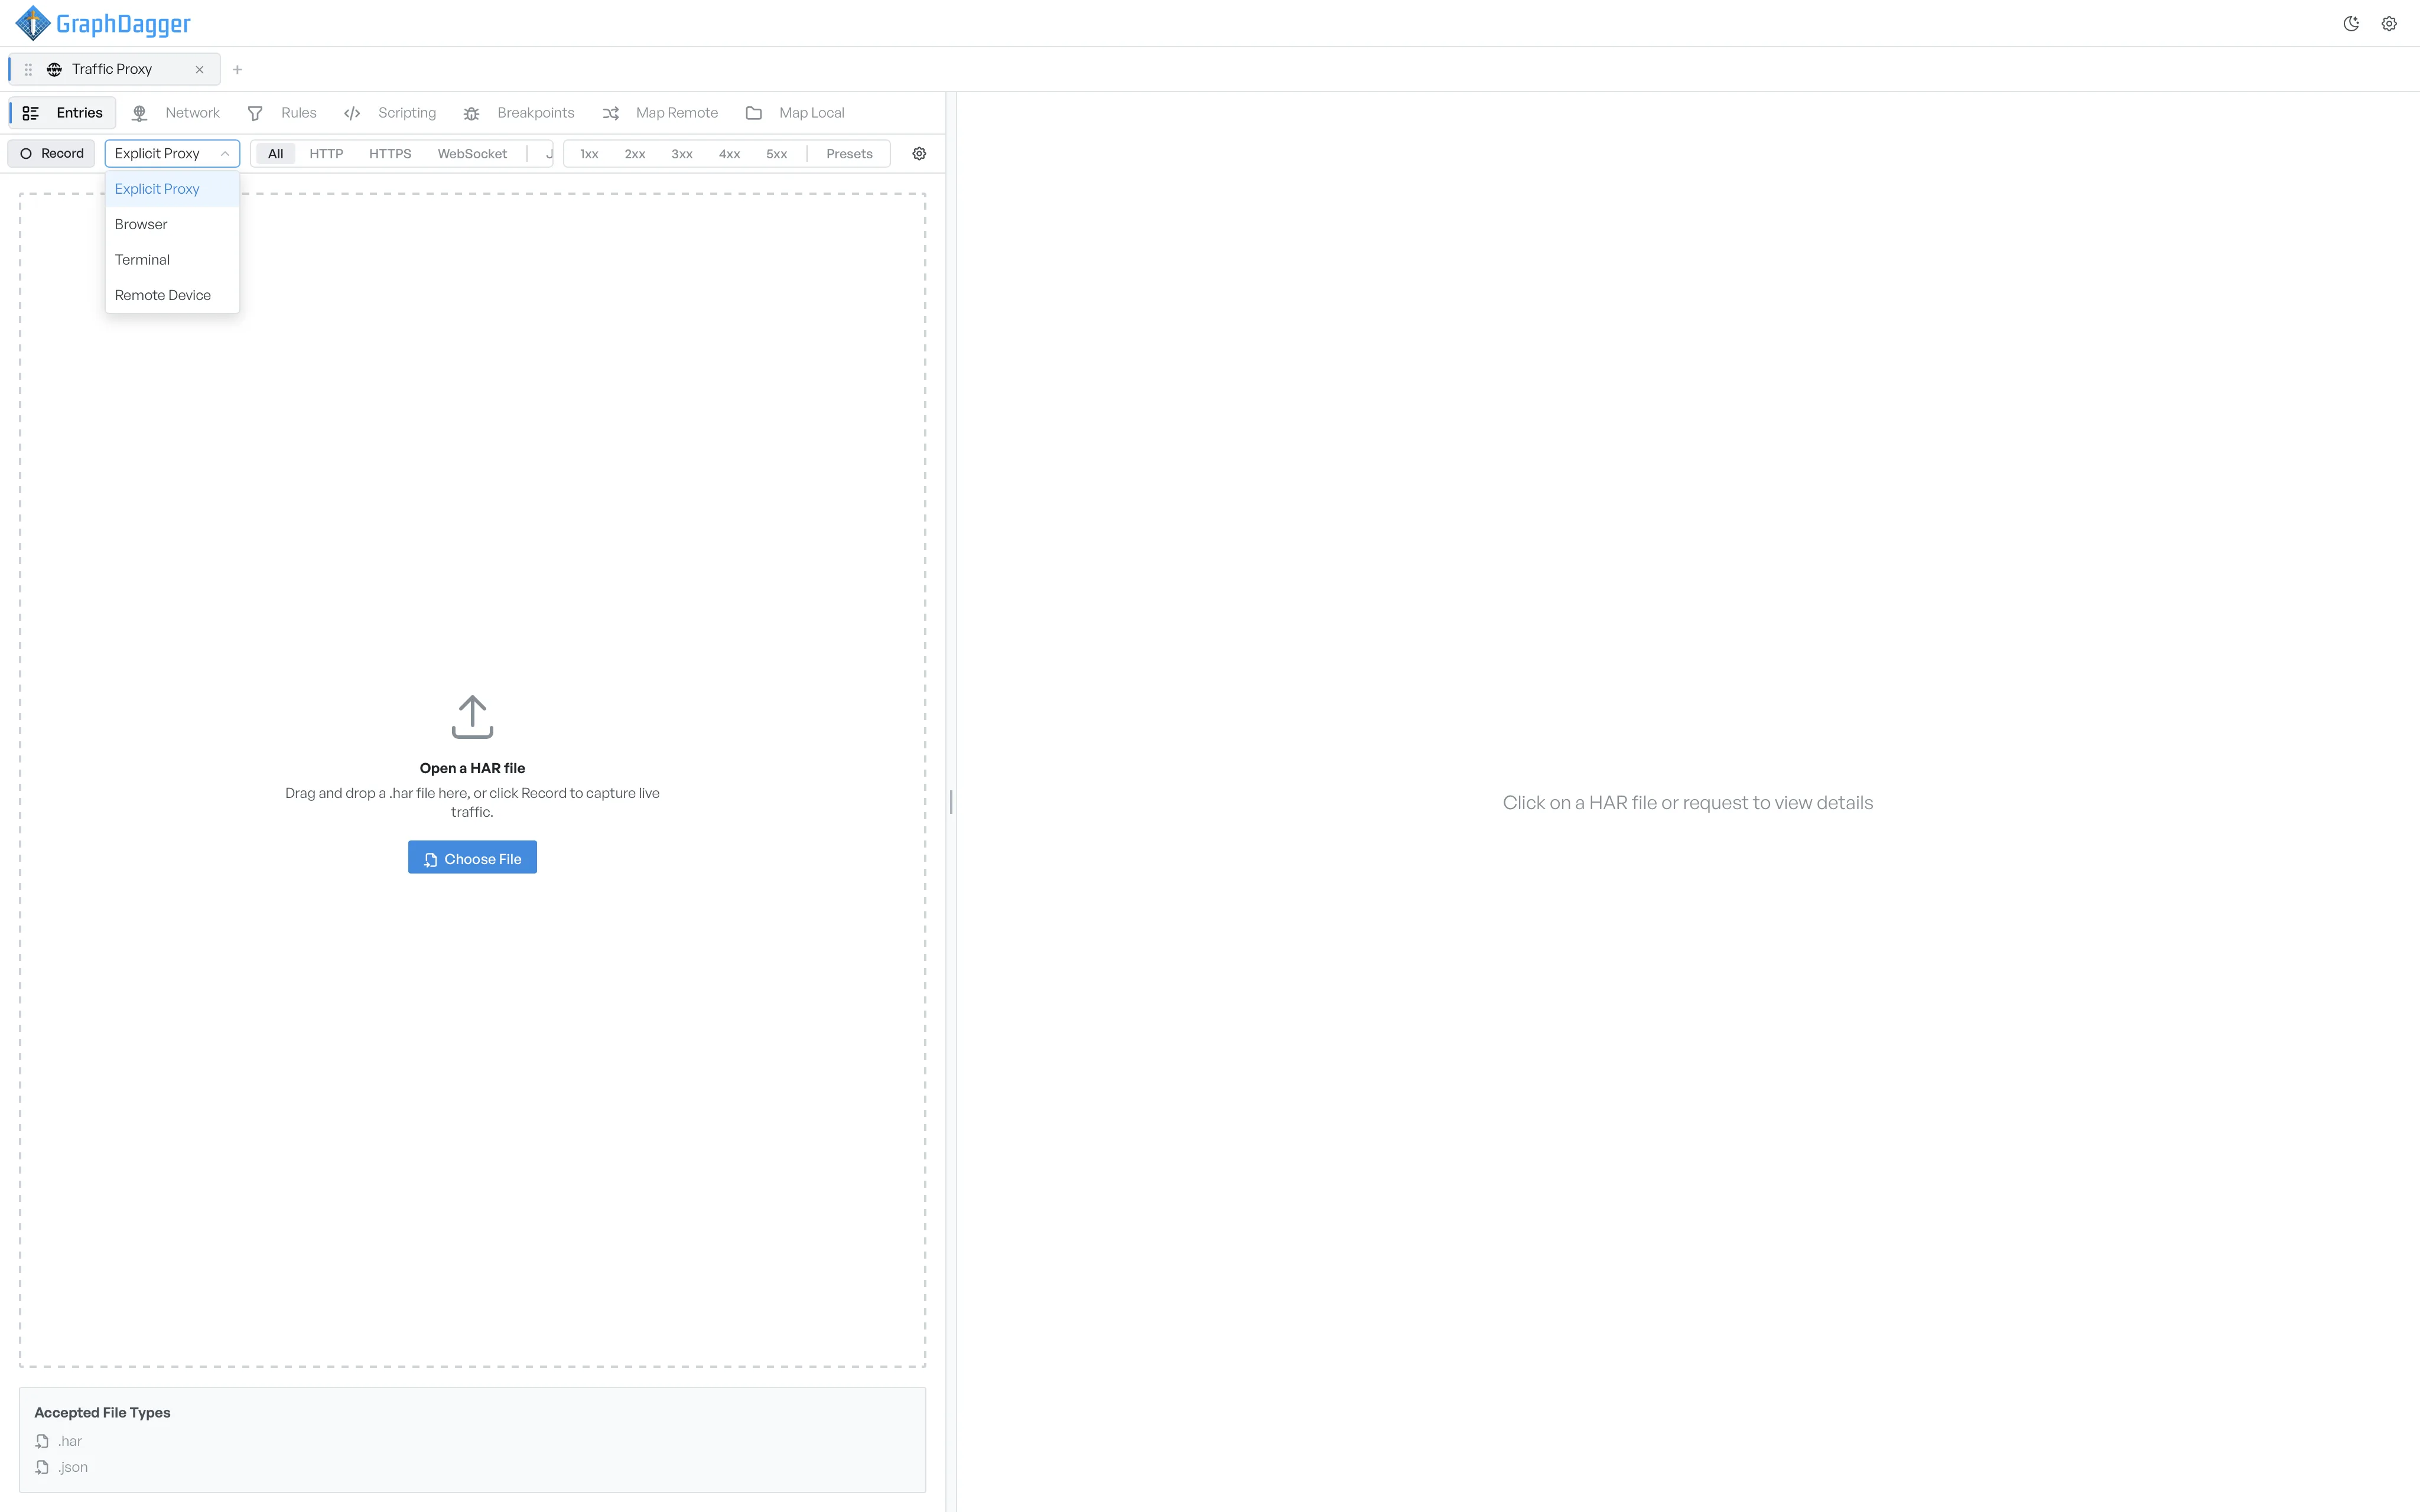
Choose how traffic reaches the proxy from a single dropdown: an explicit proxy port any client can point at, an instrumented browser window launched straight from the app, a terminal with the proxy environment already set, or a phone on your network paired via QR code. Map Remote redirects a host or URL to another host, Map Local serves URLs from a directory on disk, and sessions import and export as standard HAR files.
- Explicit proxy, browser, terminal and remote device capture
- Map Remote and Map Local for redirecting requests
- HAR import and export, plus CSV export of request metadata
Try the reading half in your browser
The parts of the Web Debugger that read a capture, the entries grid, the request and response detail panel and the waterfall timeline, run in the browser as a free HAR viewer. Drop in a .har file to see the same interface before you install anything. Capture, breakpoints, rules and scripting need the local proxy, so those stay in the desktop app.
Open the free HAR viewer