Playwright Inspector
Review and analyse collected network traces: timeline visualisation and detailed request inspection.
Replay recorded browser sessions
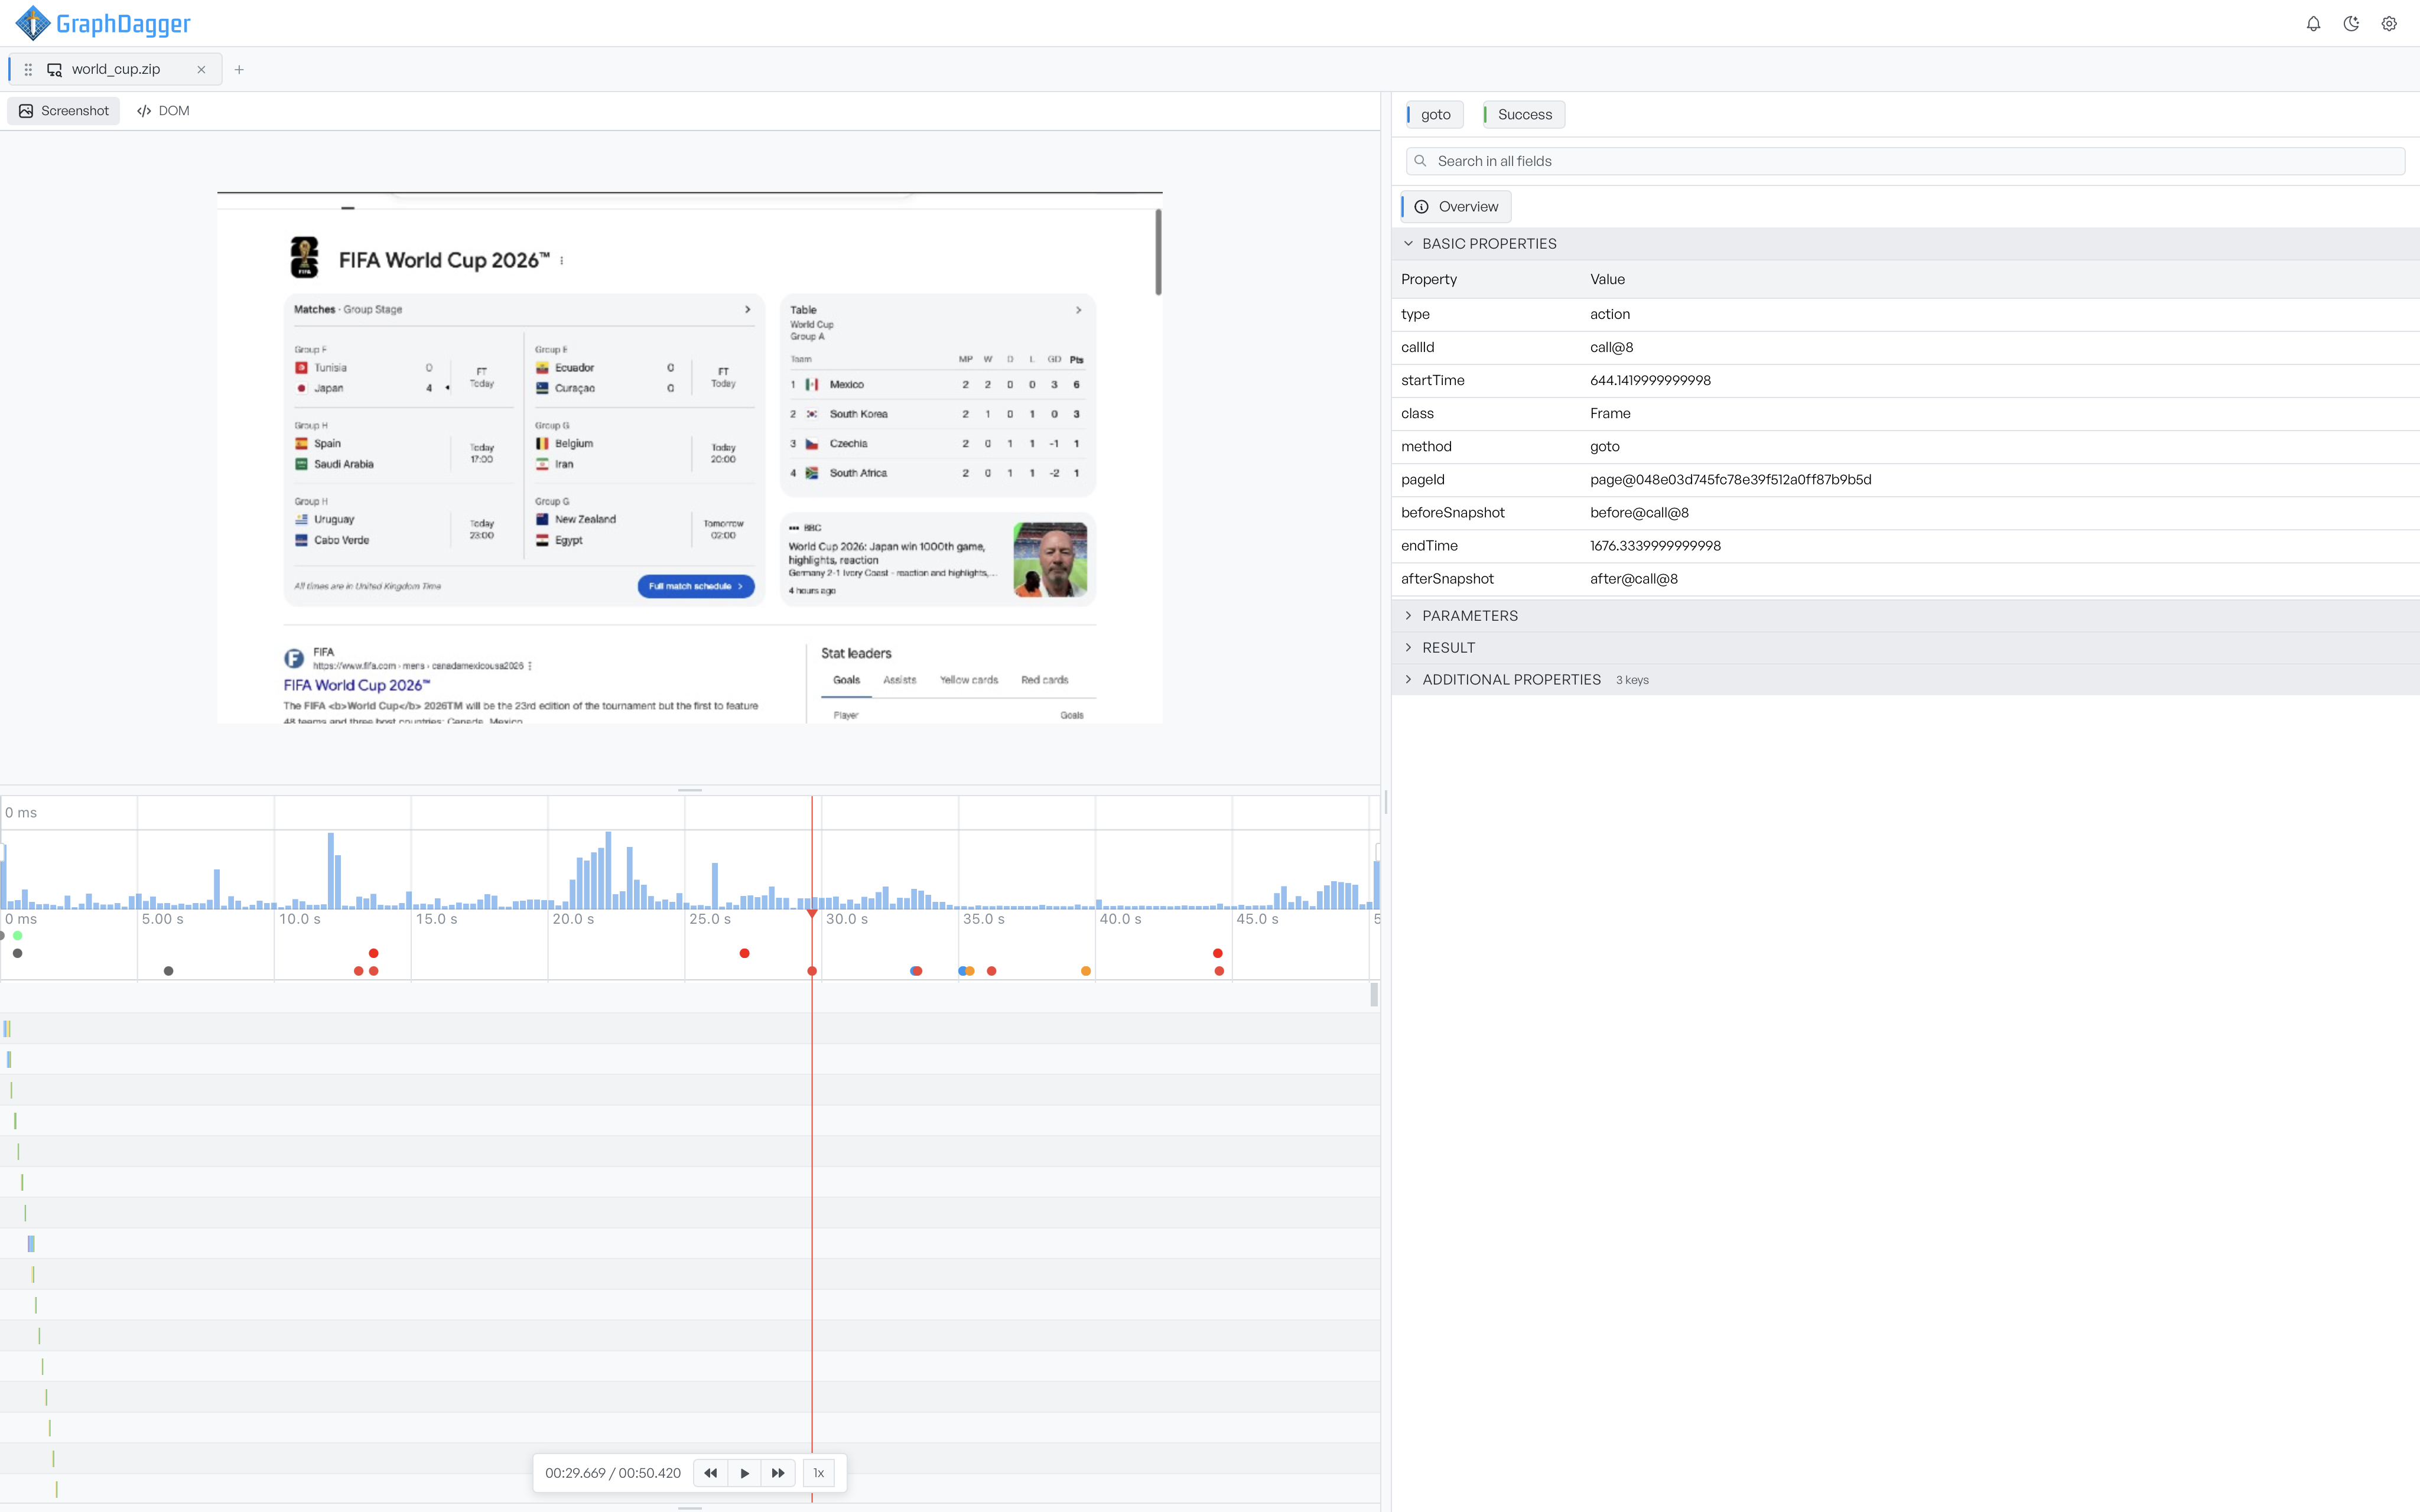
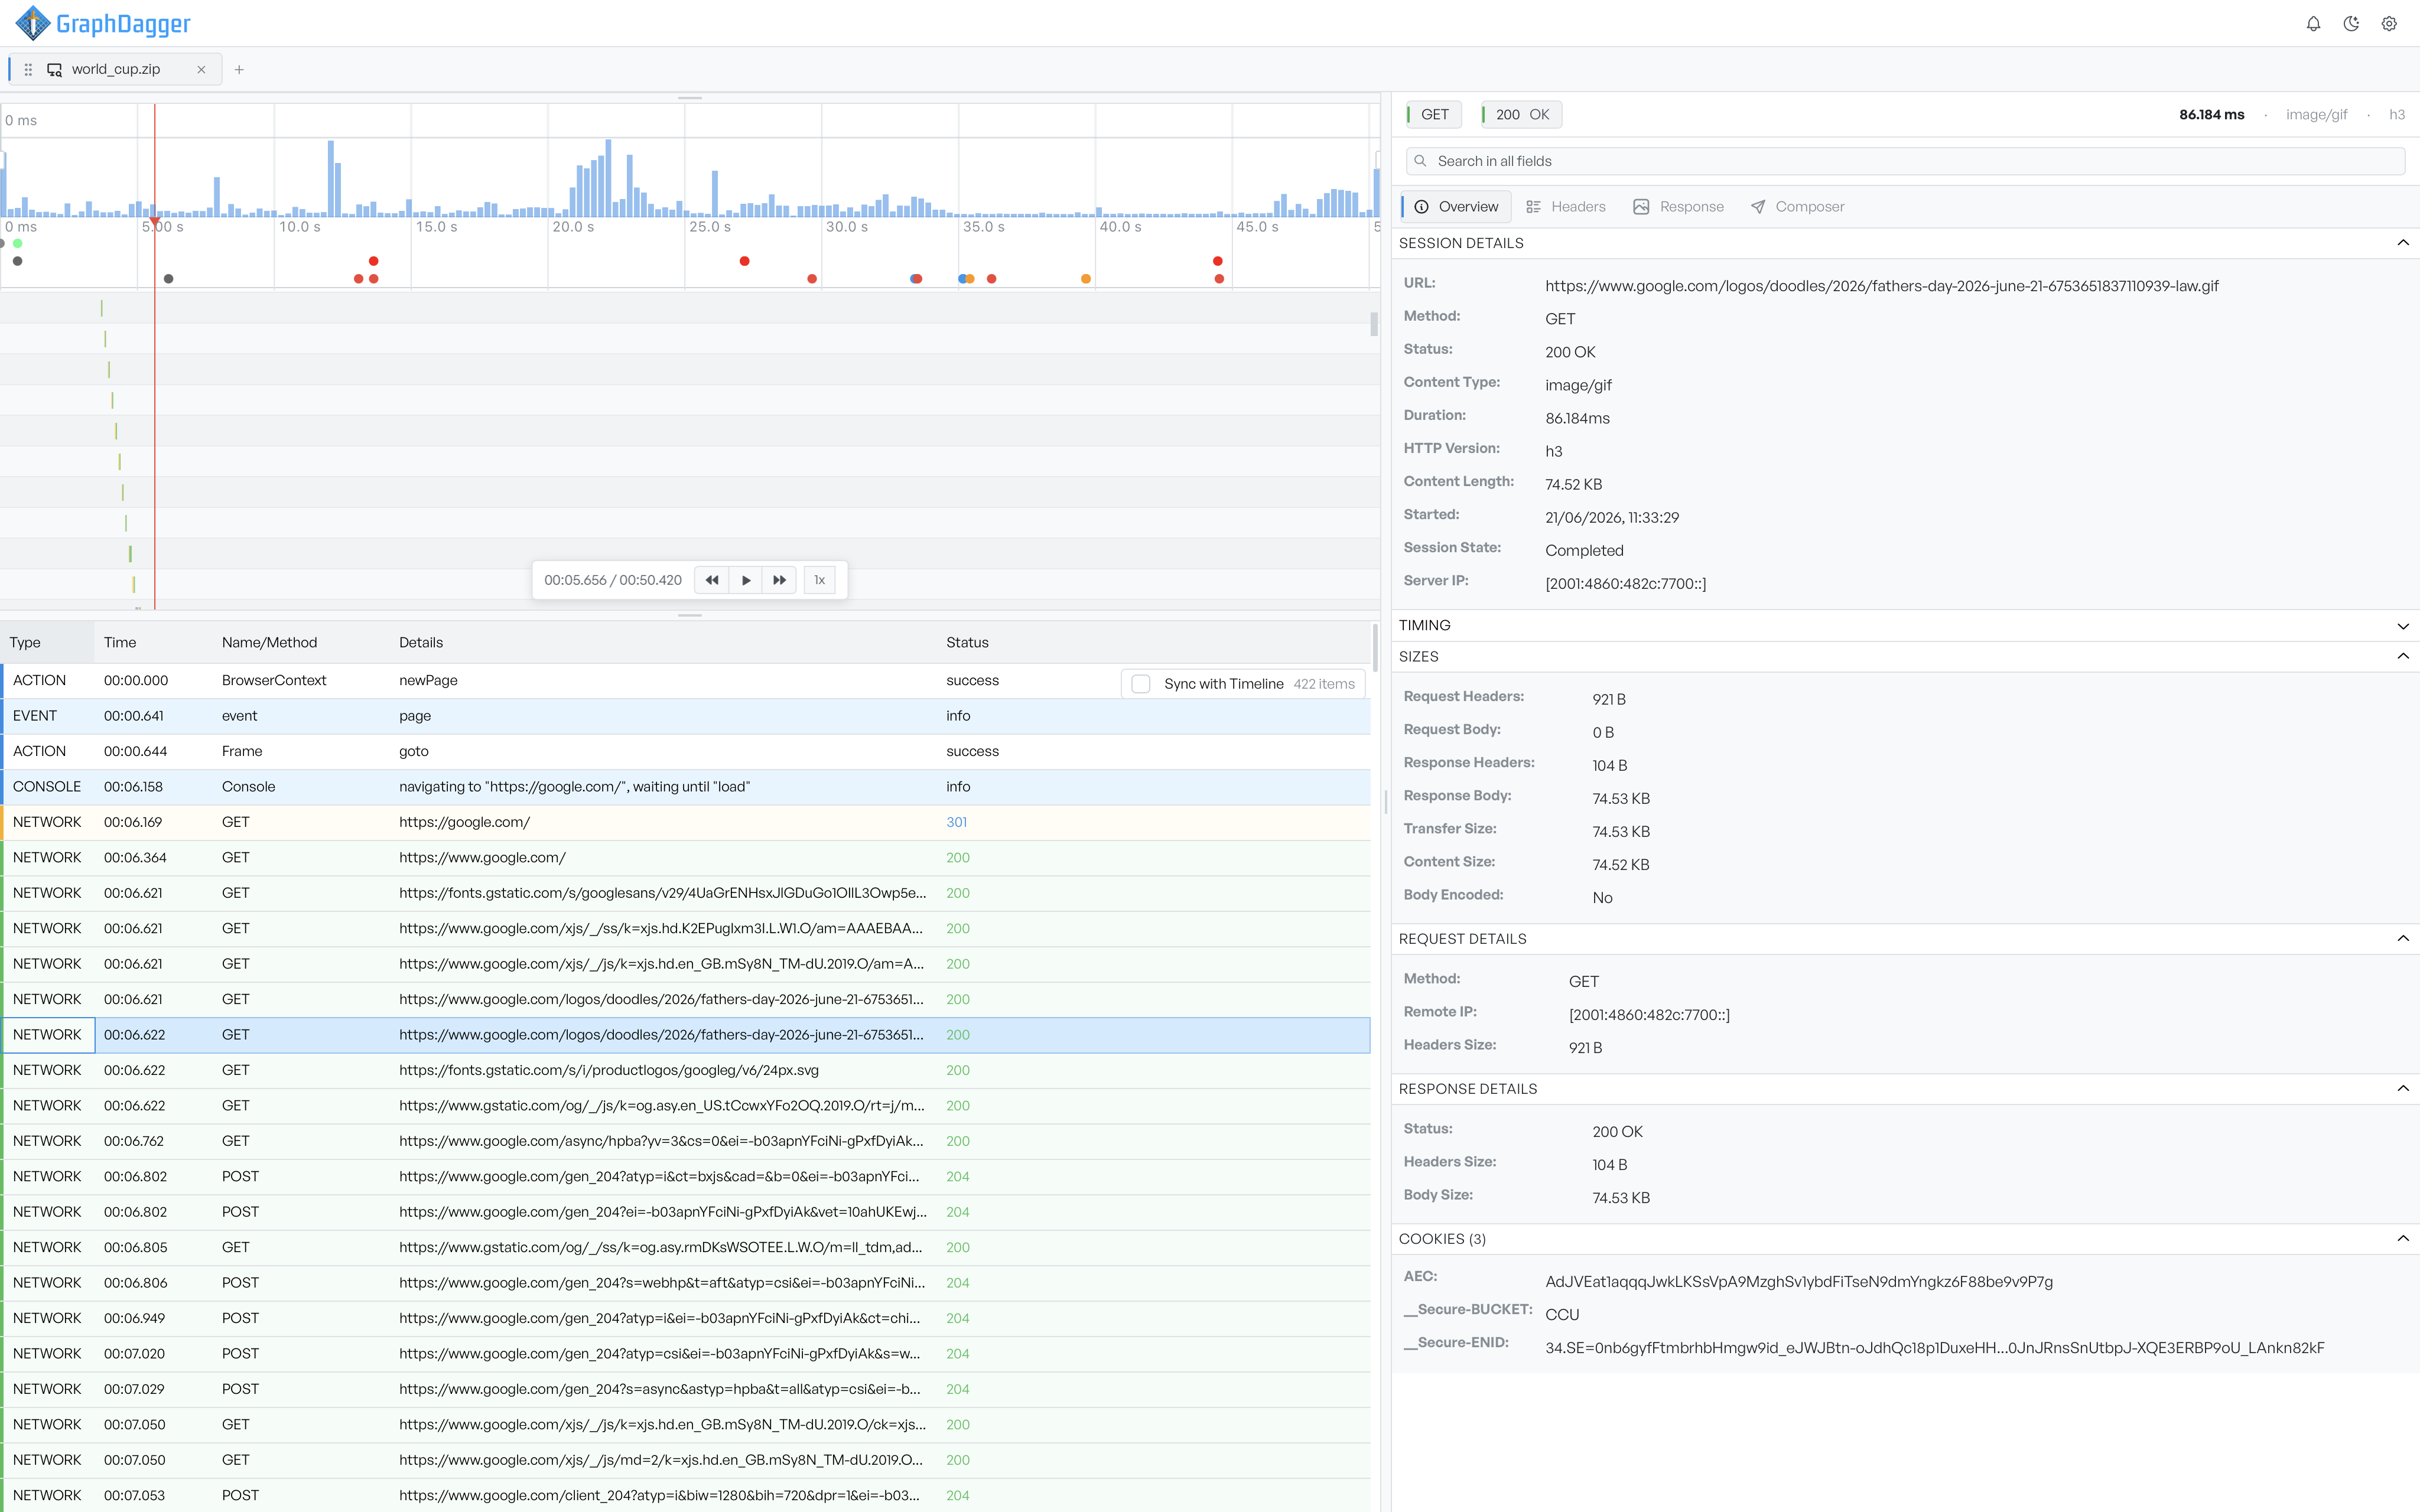
Open a Playwright trace and step through it like a video. The preview shows the page as it looked at the current time, the timeline underneath plots activity across the run, and the inspector on the right lays out the properties of whichever action you select, down to the call's parameters and result.
- Opens Playwright .zip and .trace files
- Page preview, timeline and events on one clock
- Call-level detail for every recorded action
Step through the run in sync
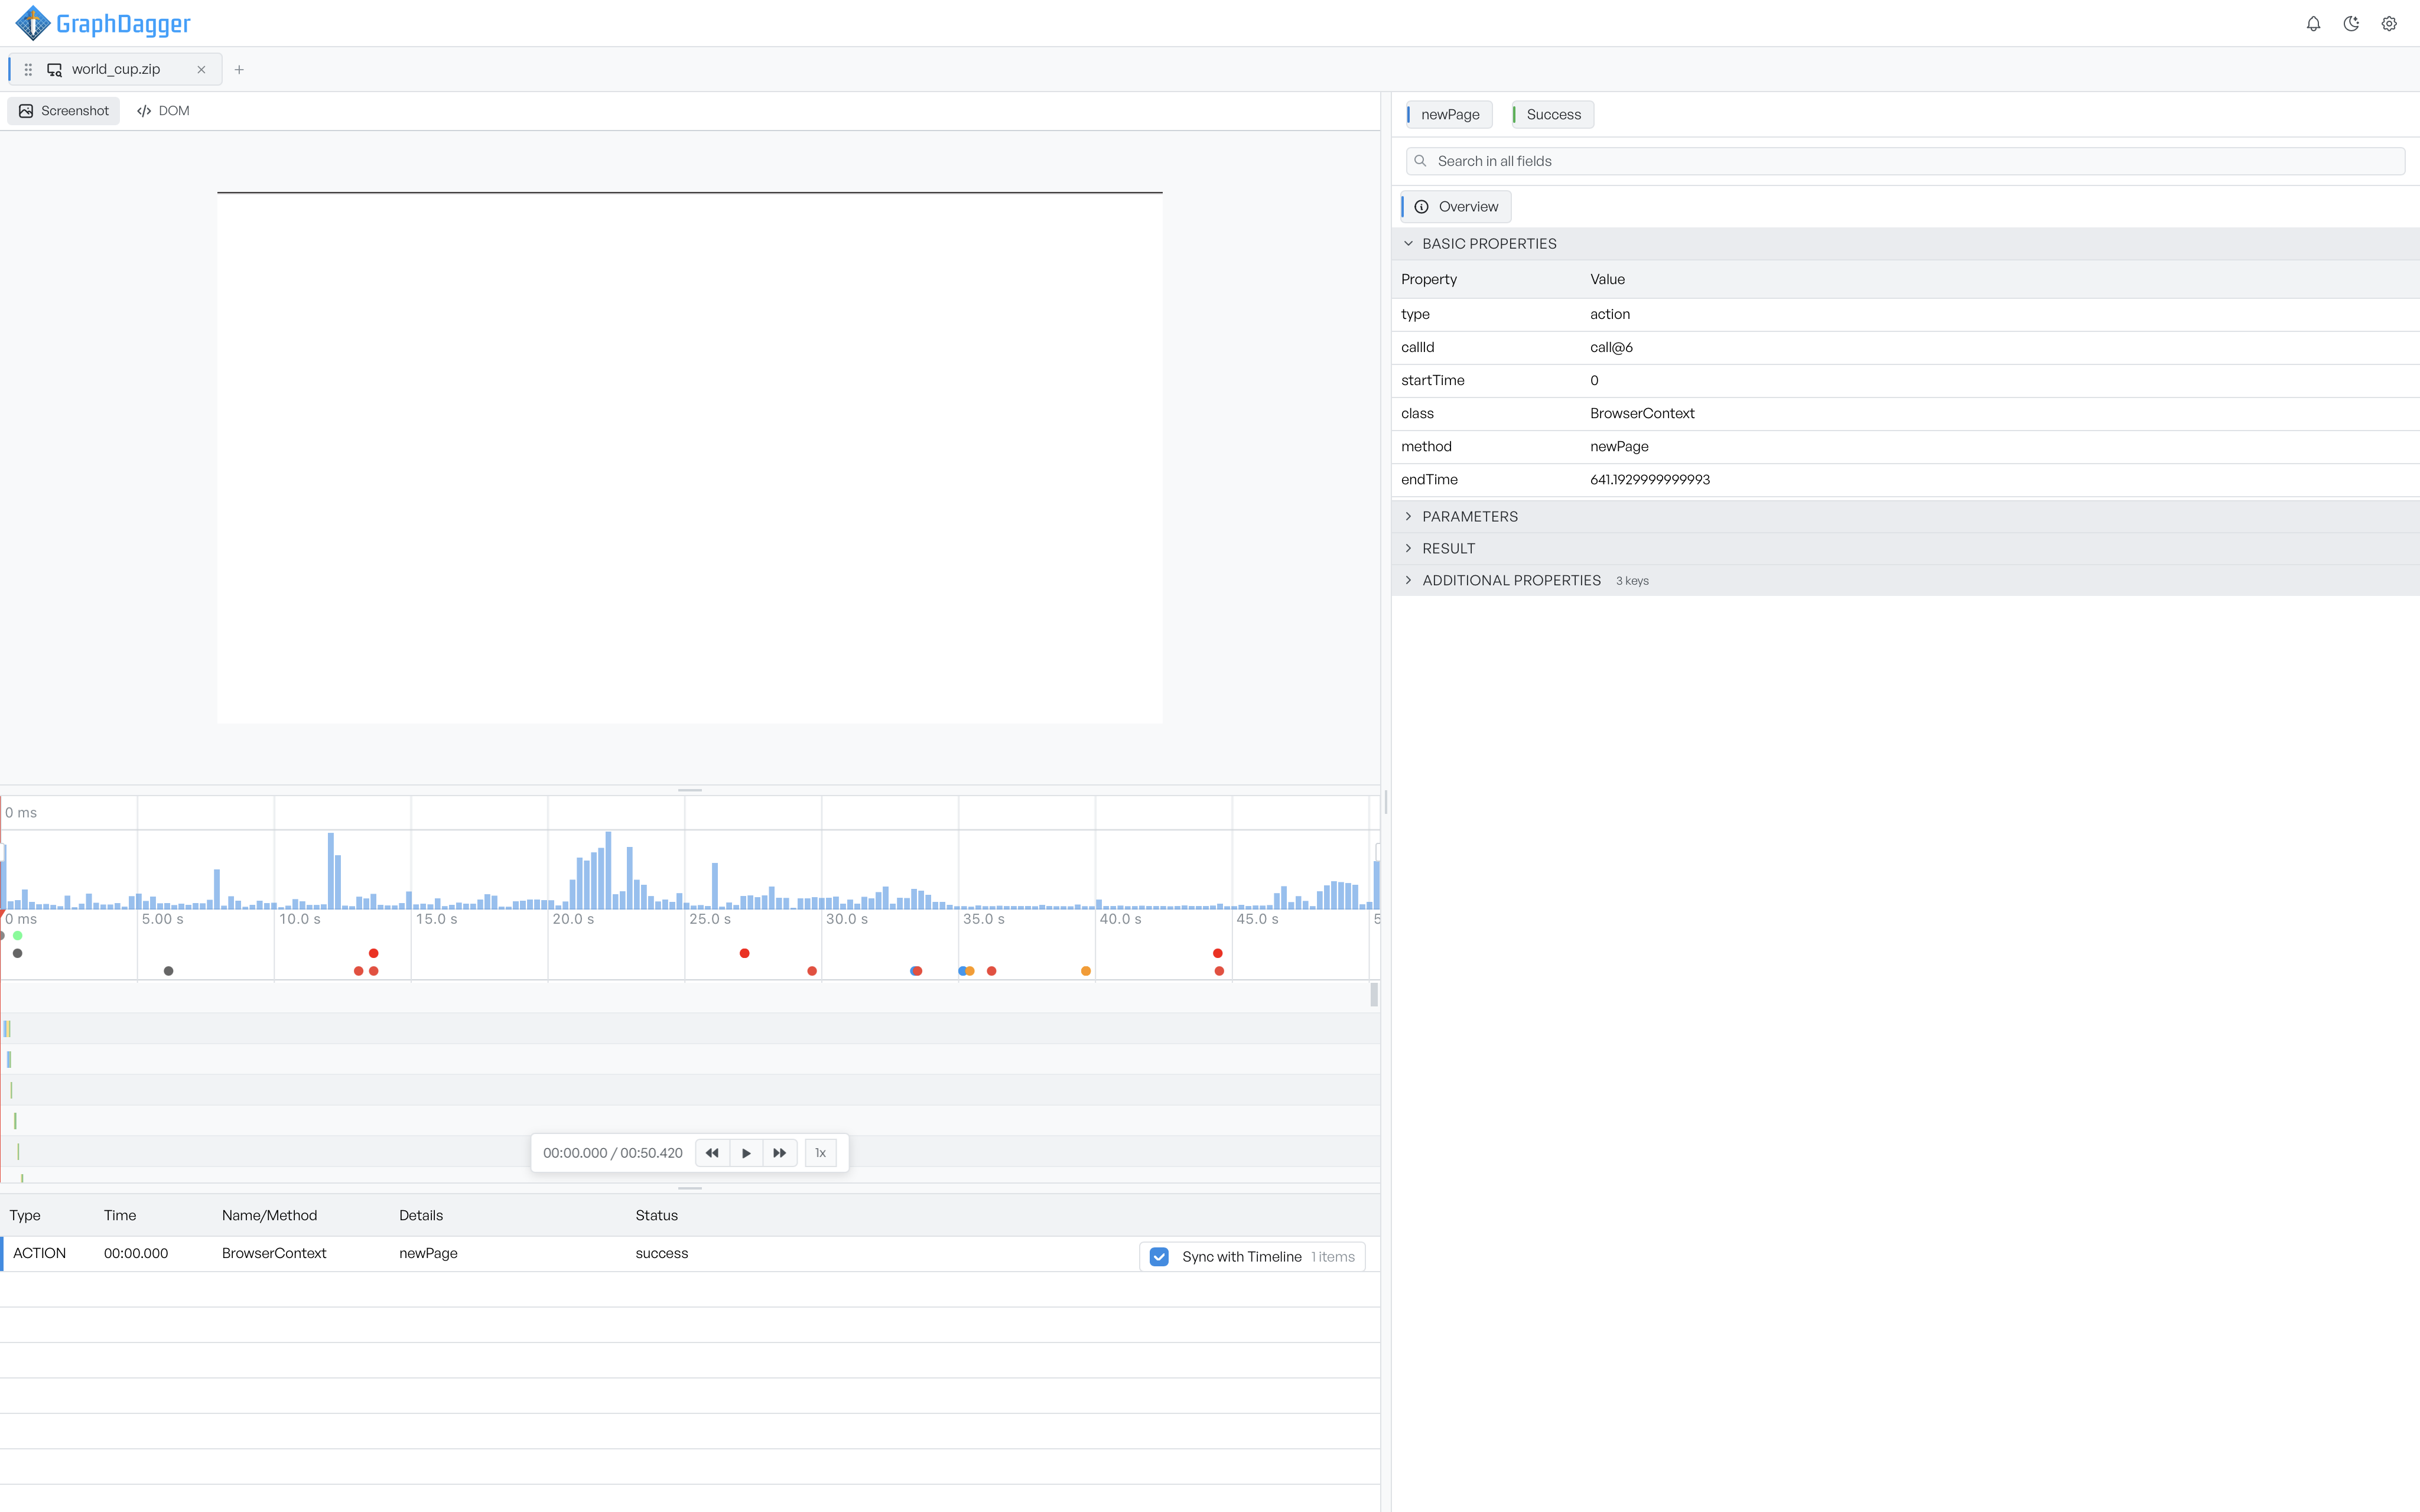
The play controls under the timeline replay the session from the current time, and the step buttons jump action by action rather than by a fixed number of seconds. Playback speed cycles from 0.25x to 4x, and because every panel tracks the same clock, moving the playhead moves the preview, the timeline and the selected row together.
- Play, pause and action-by-action stepping
- Playback speed from 0.25x to 4x
- Keyboard scrubbing with arrow, Home and End keys
One events list for everything
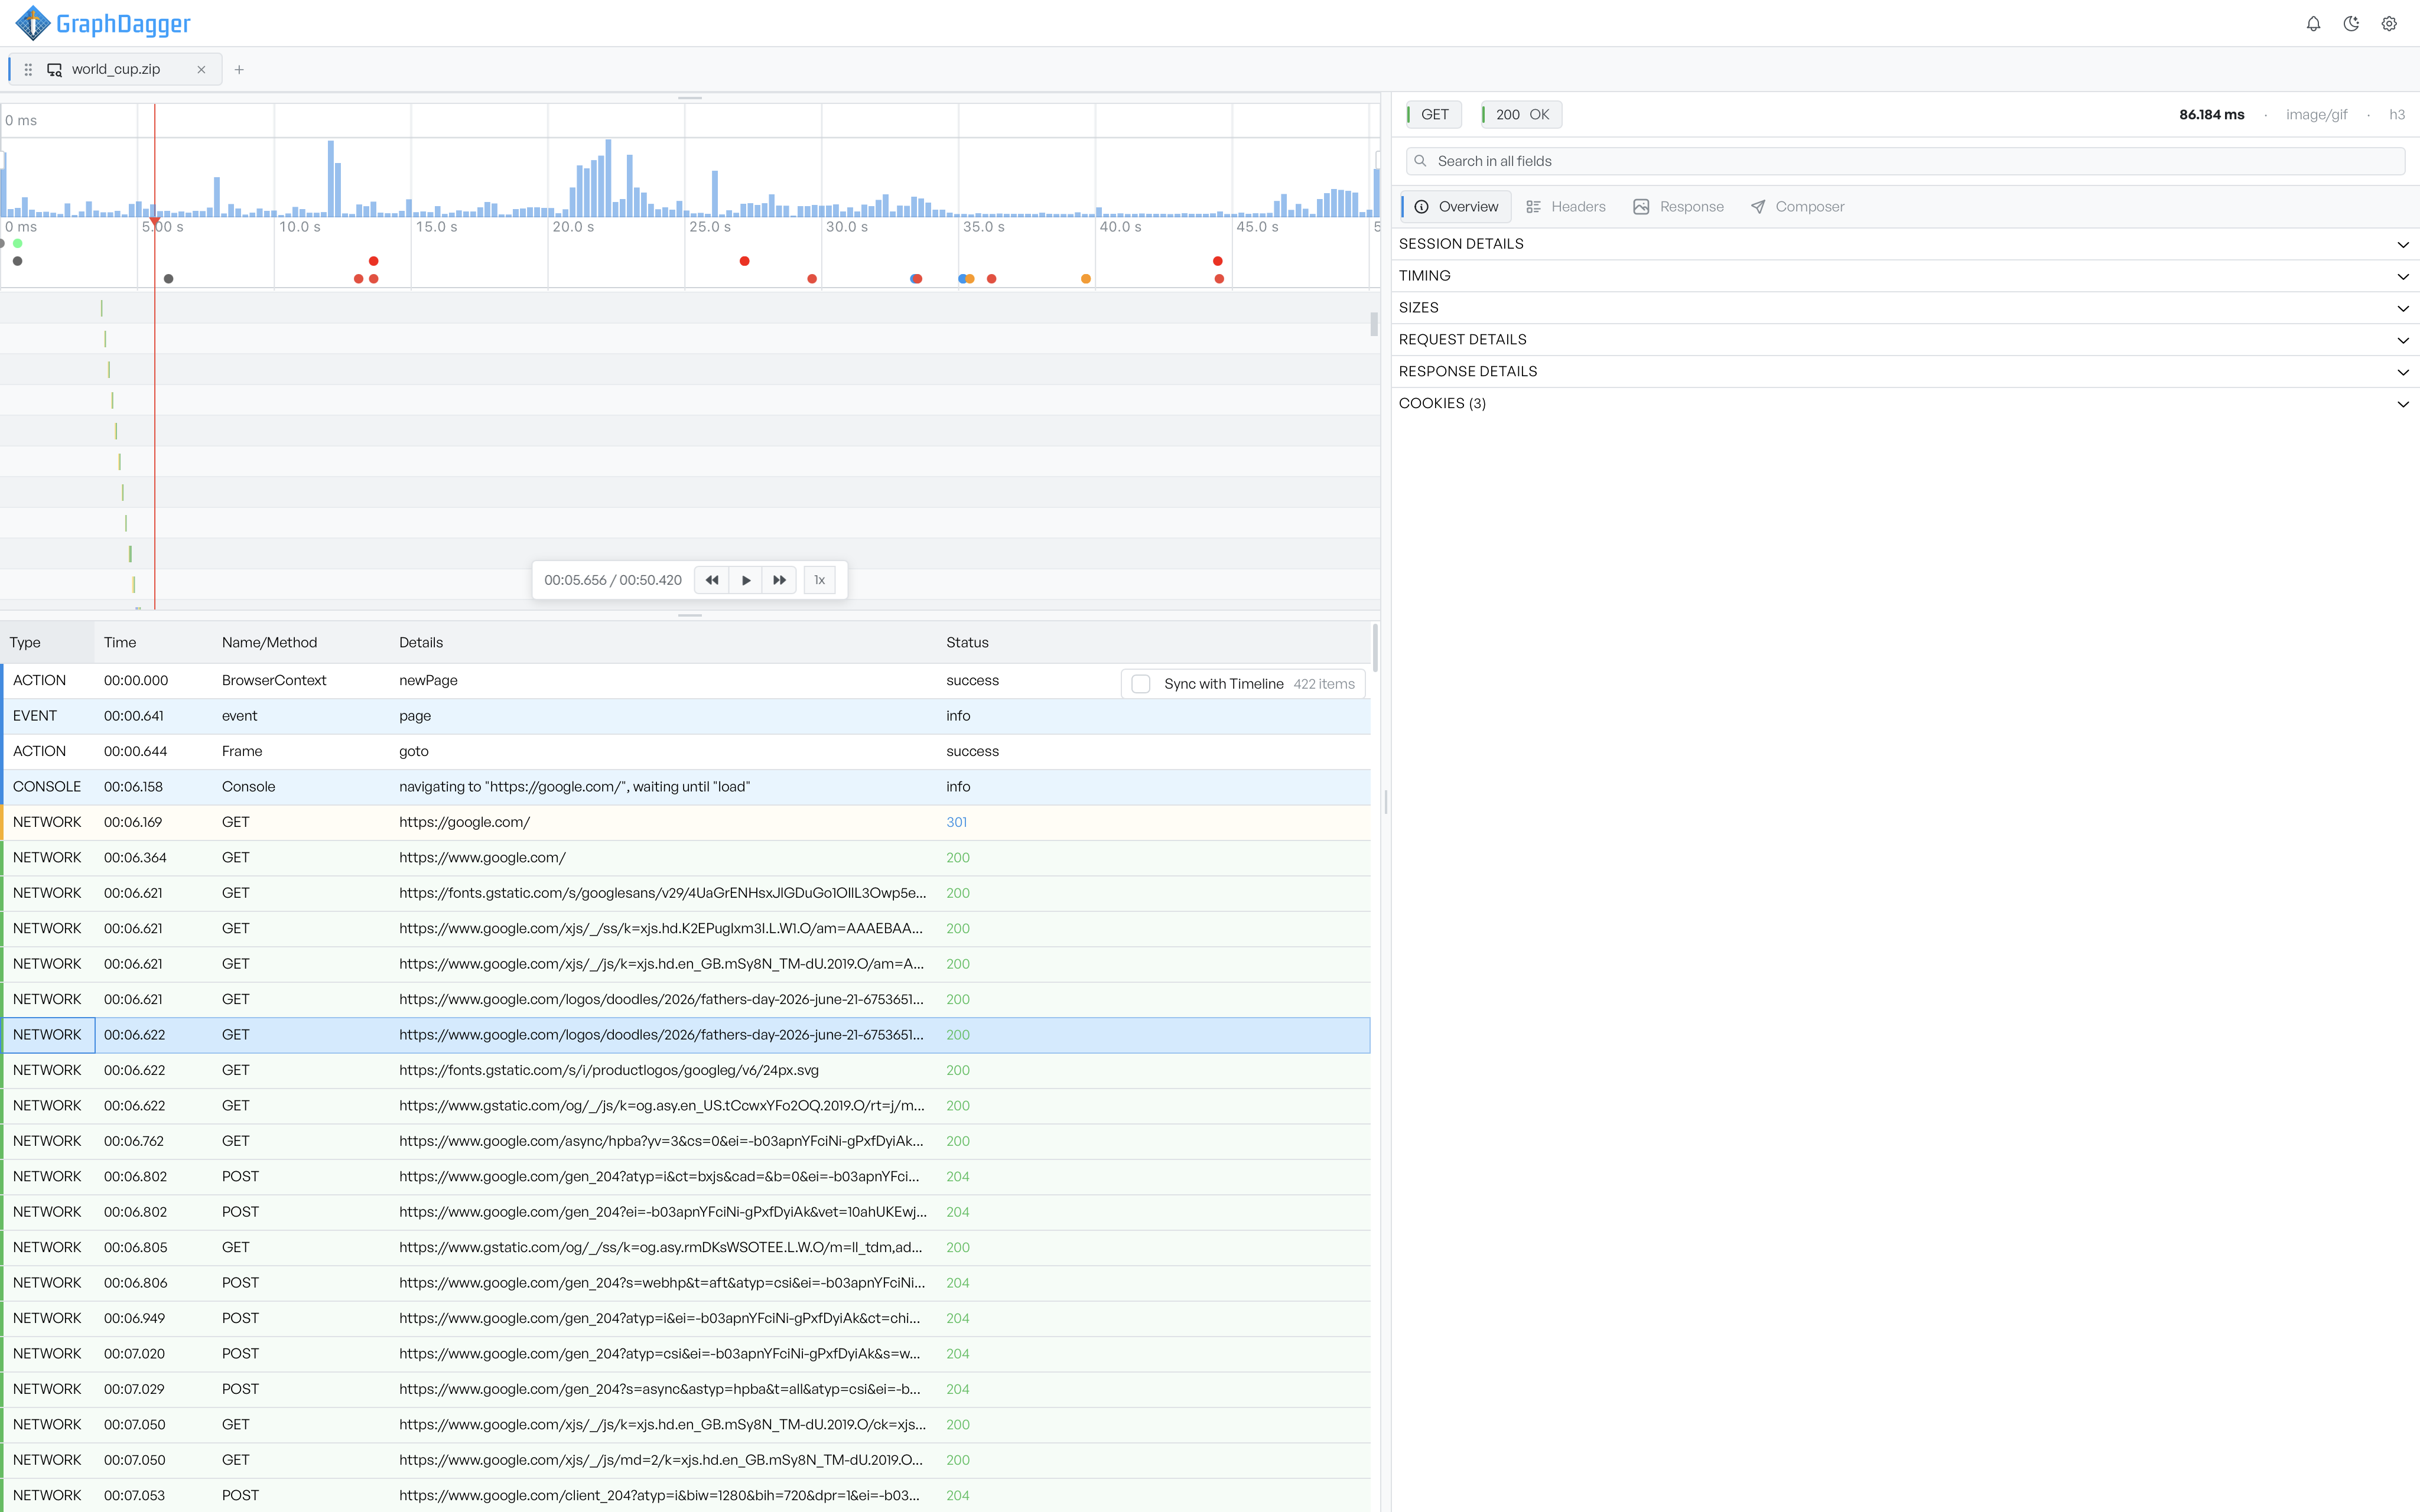
Actions, page events, console messages and network requests sit in a single table in time order, each row colour-coded by kind and network rows by status, so failures stand out as you scan. Select a network row and the full request opens in the same inspector the Web Debugger uses: session details, timing, sizes, headers, response body and cookies, with search across every field. Turn on Sync with Timeline to show only what has happened up to the playhead.
- Unified, filterable table of every trace event
- Full request inspector with search across all fields
- Network waterfall on the zoomable timeline
Point at the page, get a locator
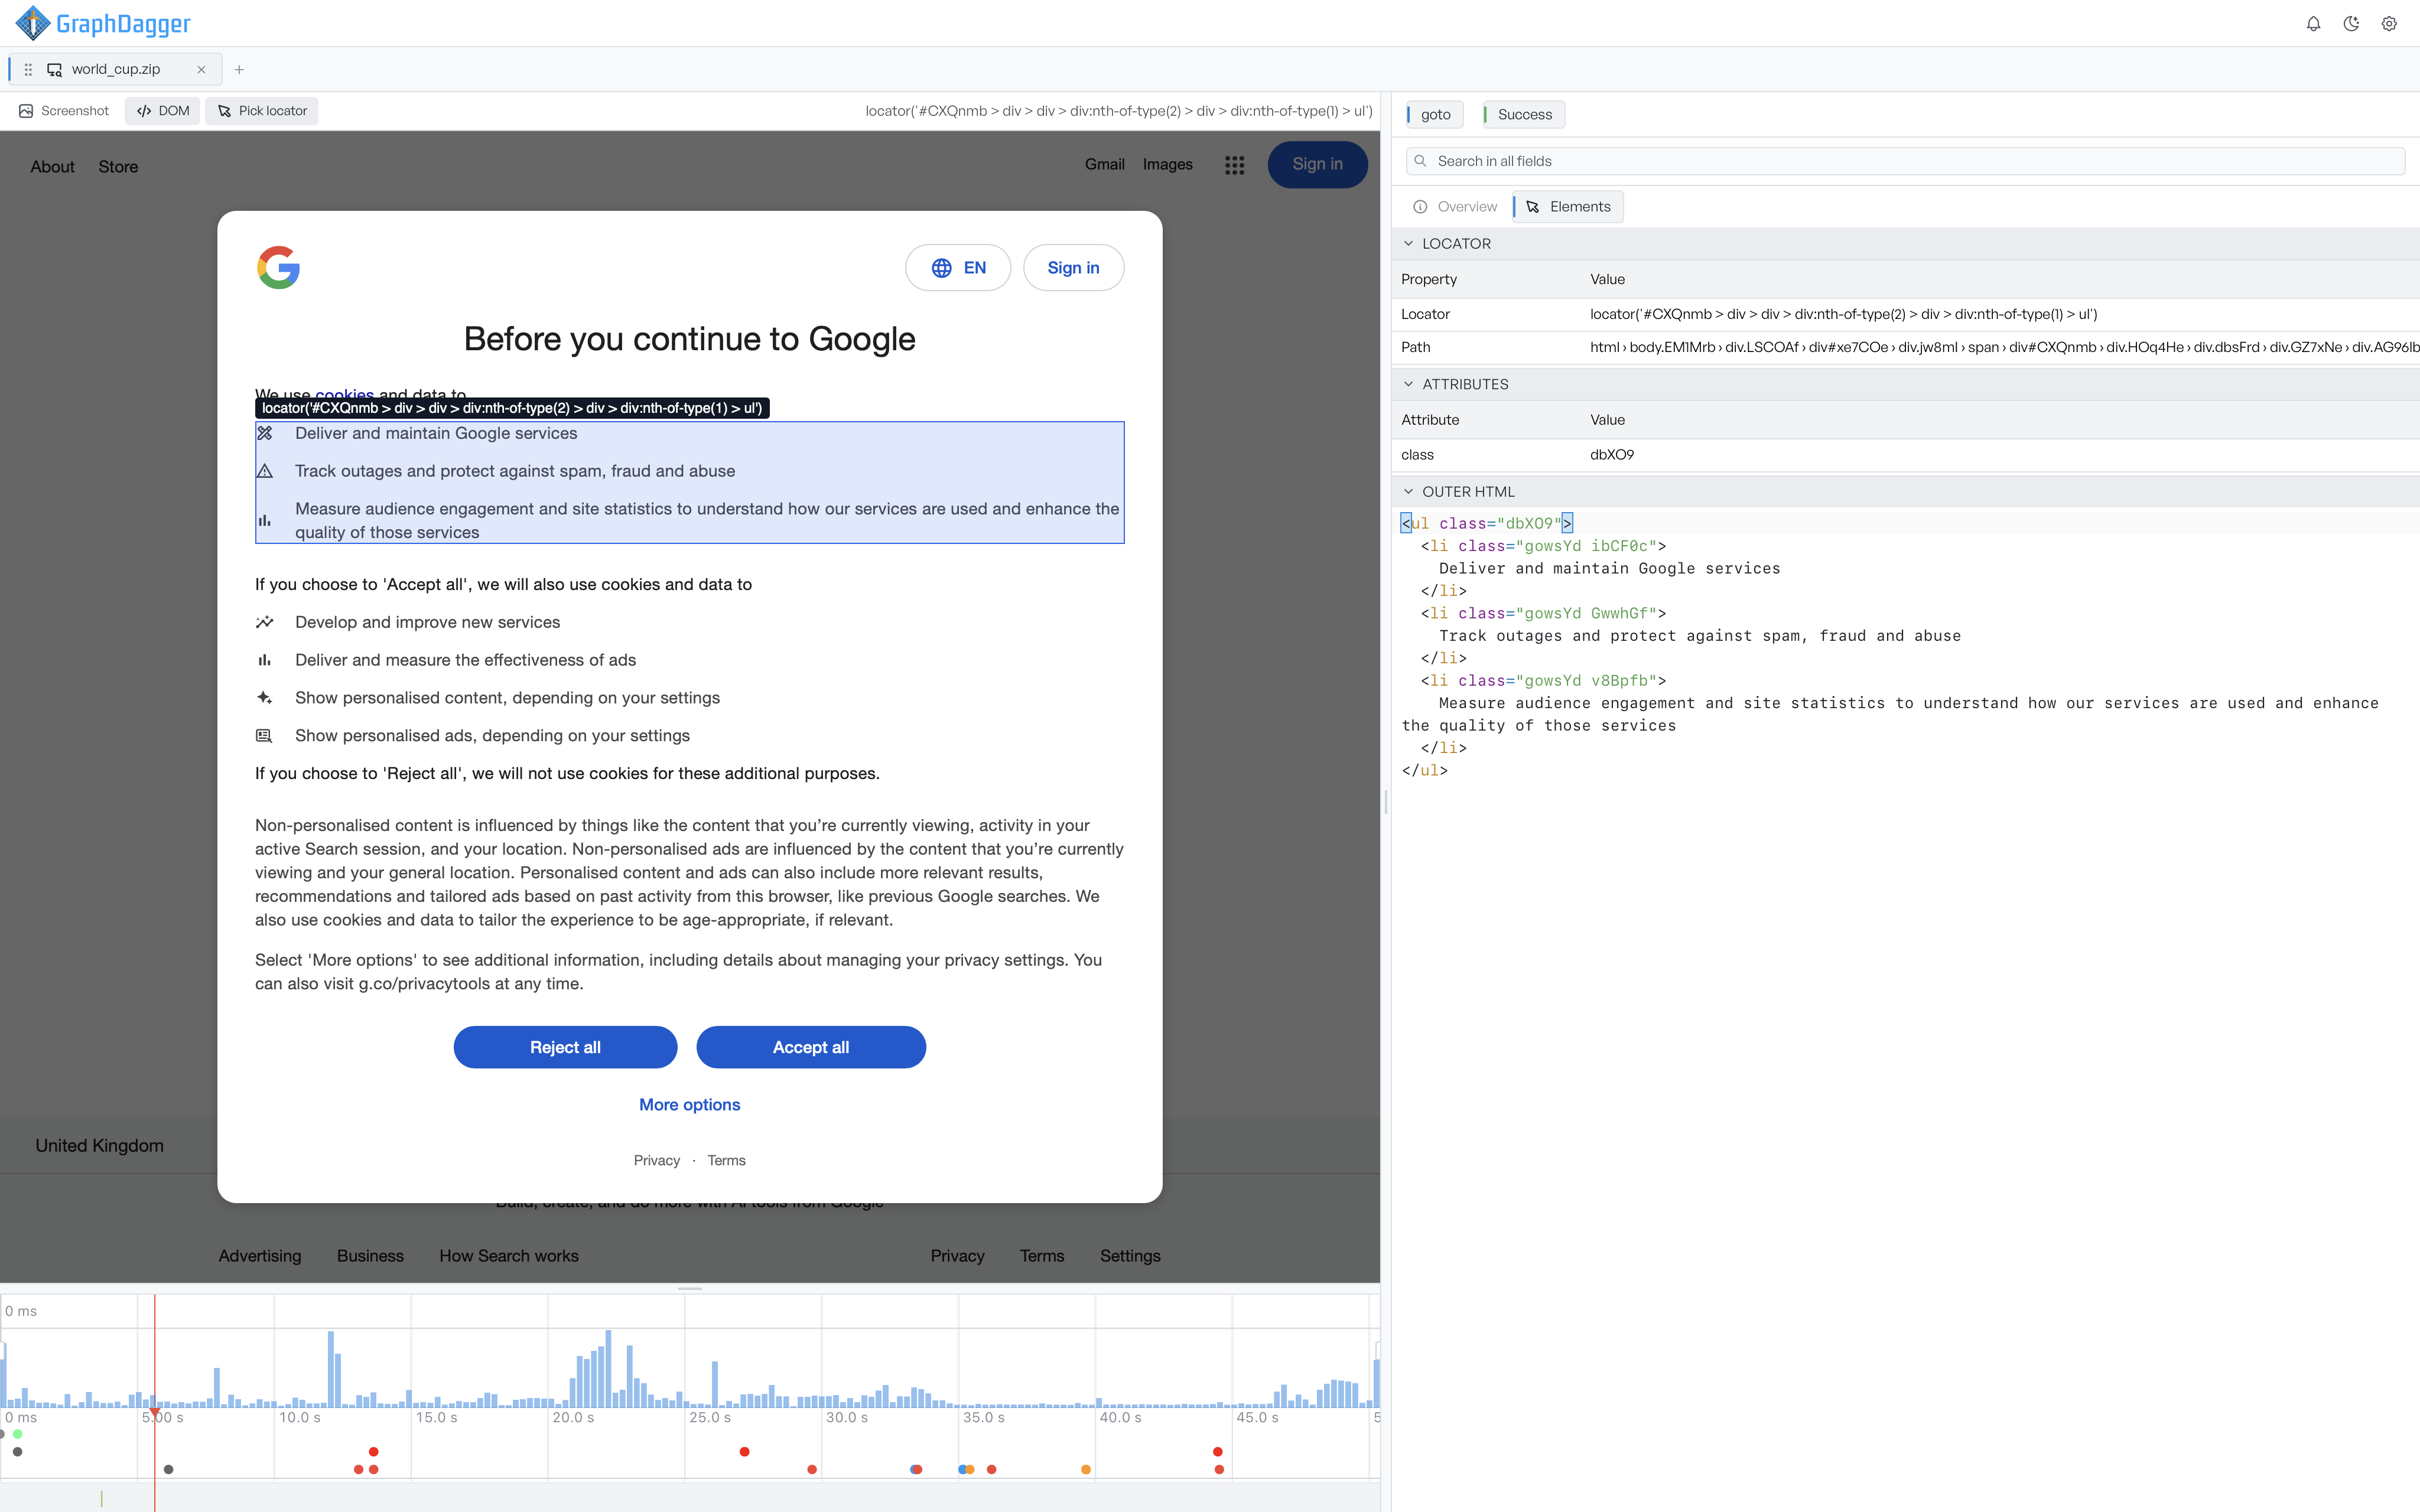
In DOM mode the preview holds the real structure of the page, not a picture. Turn on Pick locator and the element under the cursor is outlined with a suggested Playwright locator; select it and the Elements tab shows the locator, its path down the page, the element's attributes and its formatted outer HTML. The suggestion prefers stable targets such as a test id, a role and name, a label or visible text.
- Suggested Playwright locator for any element
- Attributes and formatted outer HTML in the inspector
- Prefers stable targets such as test ids, roles and labels
Record a trace without leaving the app
You do not need an existing trace to start. Pick a browser and a start address in the Record trace toolbar, select Launch, and a real browser window opens. Use the site as you normally would while everything you do is captured, then Stop and Save Trace writes the session as a .zip you can load in the same tab and start reading straight away.
- Launch, drive and record a real browser session
- Choose the browser and the address it starts at
- Save as a .zip and reload it in the same tab