GraphDagger replaces
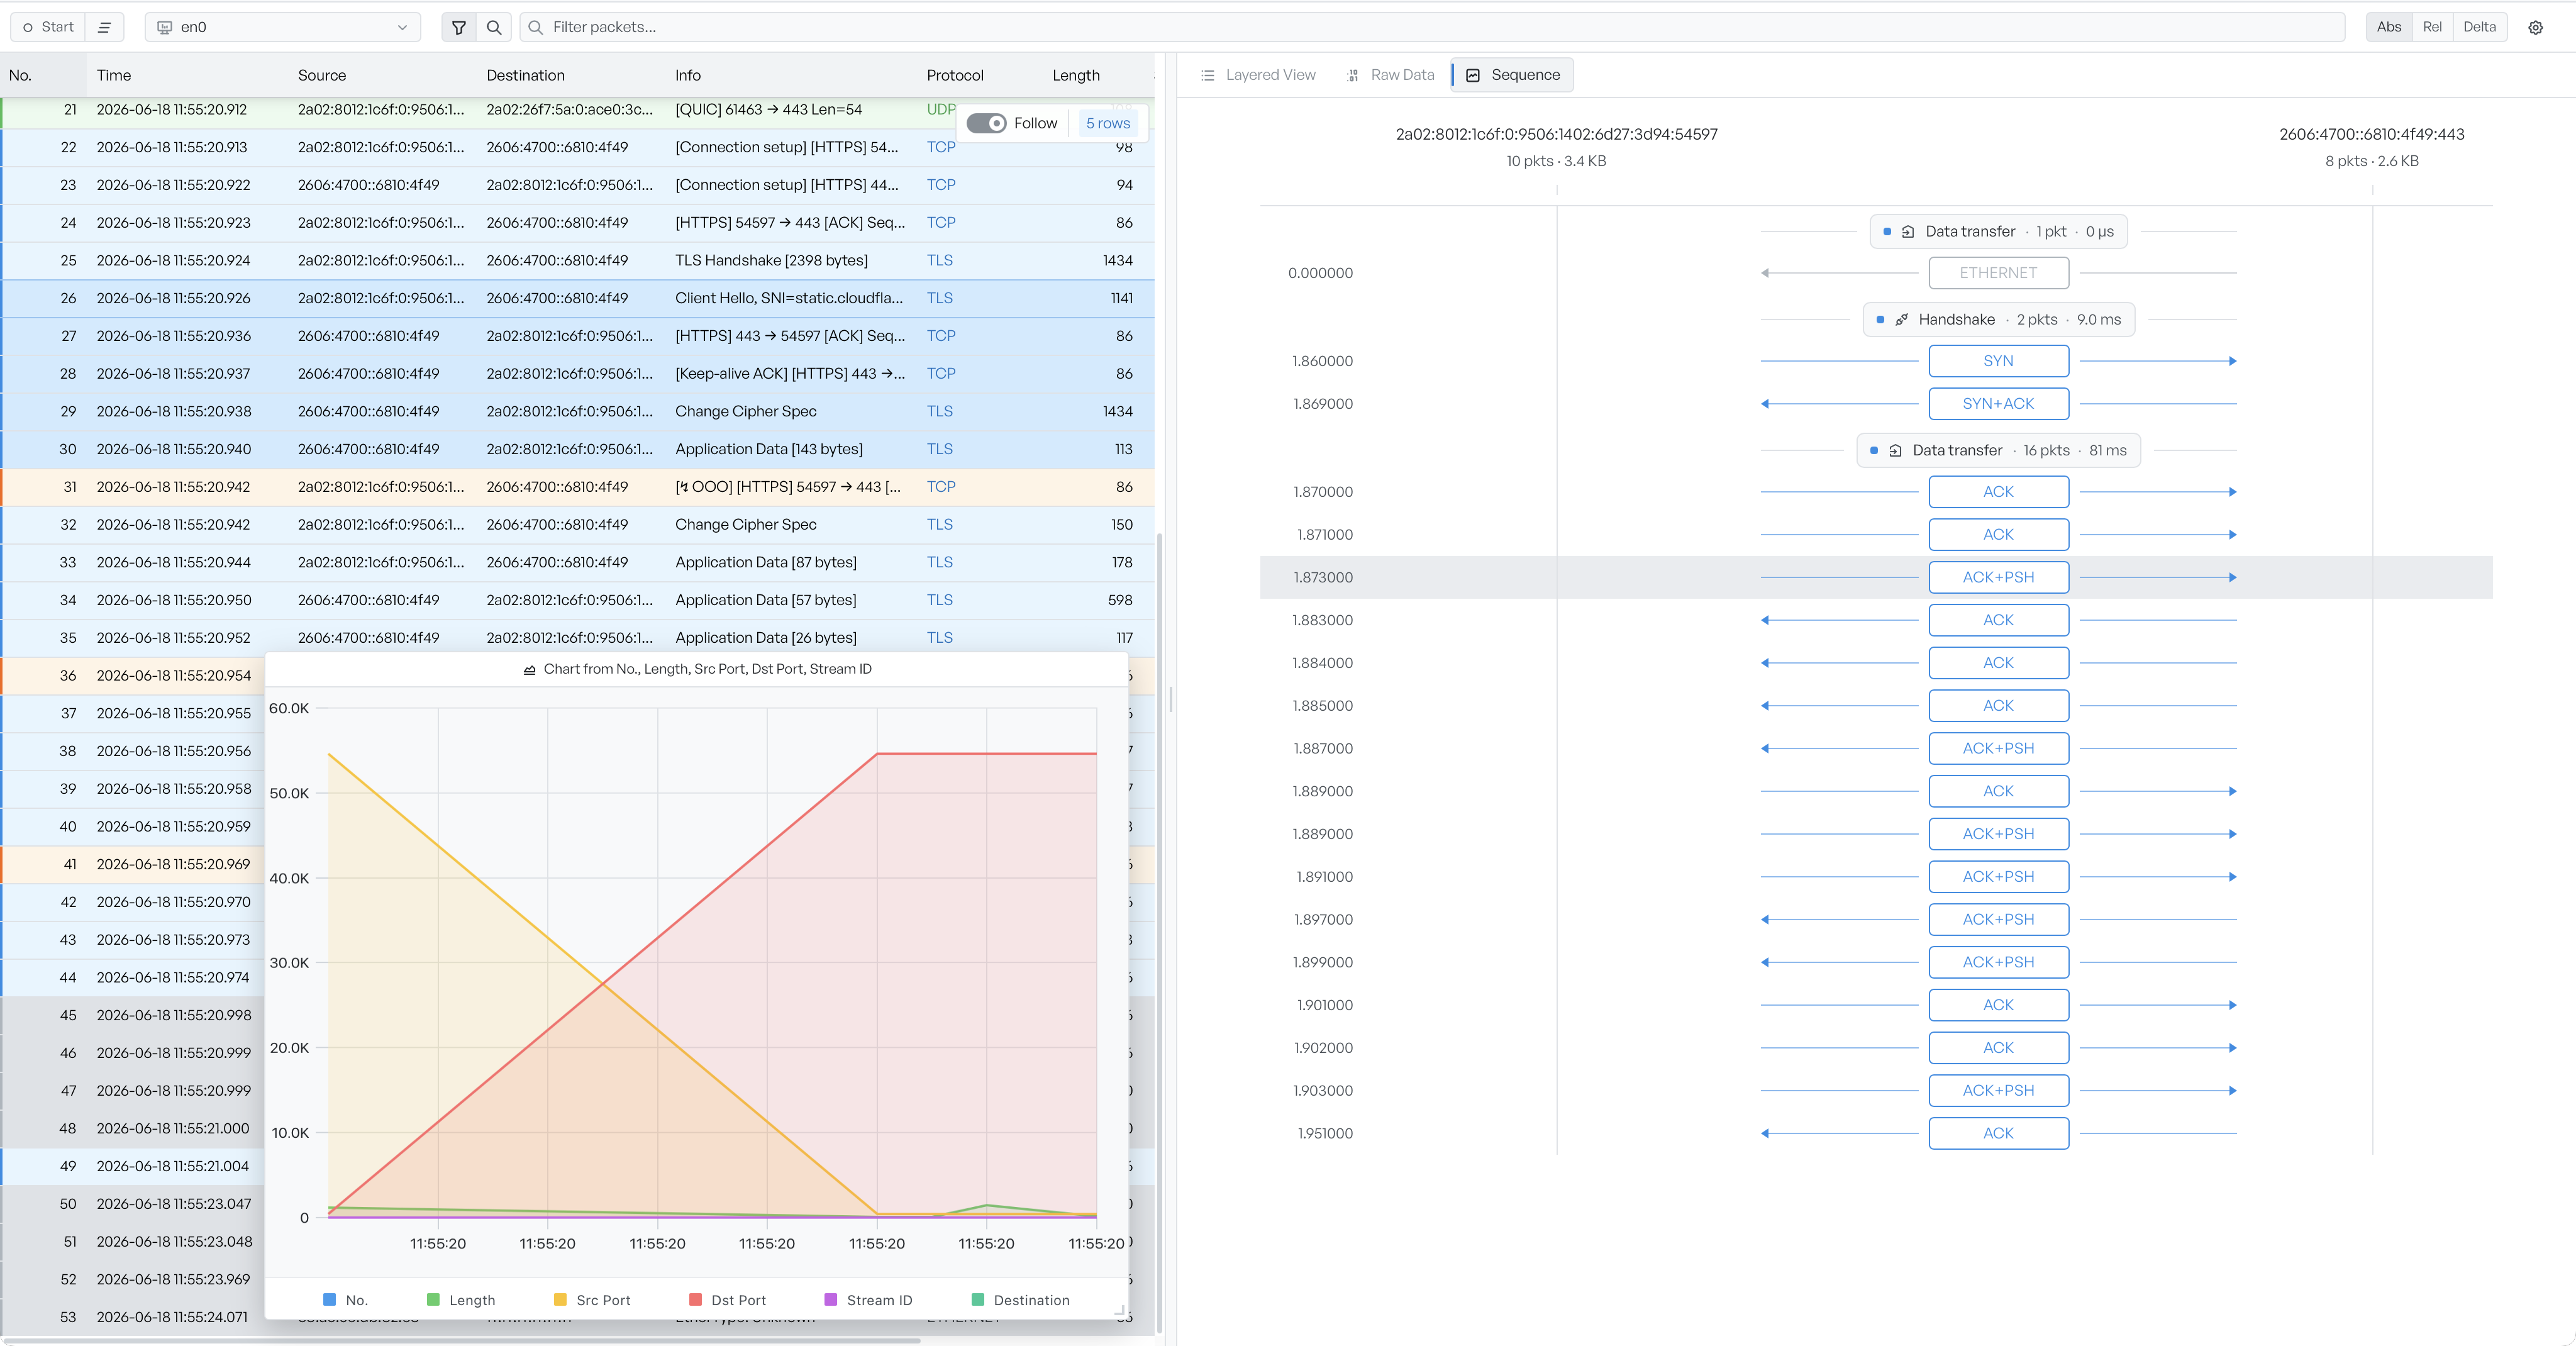
Stop constantly switching between multiple different apps
- GraphDagger is the unique, all-in-one diagnostic app for packets, APIs, logs, tokens and the box you SSH into.
- Capture, inspect, decode and diagnose with ease.
- No more juggling a dozen separate tools, licences and windows, which saves you real time on every job.
- Sensitive information is safe and secure. It stays private, local-first, with no telemetry.
- GraphDagger is different. Finally, a signed, deep network, native app for both macOS and Windows.
- For IT and network engineers, troubleshooting just got a lot quicker and easier.
Built by engineers, for engineers
Packet Capture
Web Debugger
API Client
Playwright Inspector
Email Forensics
File Triage
Log Explorer
Audio Inspector
Data Transform
Auth Inspector
Network Recon
Database Client
Geo Map
Remote Terminal
GraphDagger replaces all 22 of these apps, and many more
If you use 8 or more of these apps, GraphDagger will save you 6 hours every week.
Do it all, without switching apps, in one window
In GraphDagger you stay in one app. Chasing an intermittent authentication failure, you'd normally have six tools open in six windows at once. Here they're a single session:
- Packet CaptureWatch the TCP streams to the auth server
- Web DebuggerIntercept the request and response
- Auth InspectorDecode the bearer token it carried
- Database ClientCross-check the session token records
- Remote TerminalTail the auth server's application log
- API ClientReplay the request with fixed parameters
All in one app.
Every finding lands beside the others in the same session, so there's no holding six windows in your head to keep the picture straight.
See 13 tools in one incidentOne window, not twelve
When a production incident hits you, and minutes matter, you want one window, not twelve.
GraphDagger covers entire investigation chains. Having every tool in one place is not just a convenience, it is an operational advantage.
A faster resolution of a production or security incident has a value that dwarfs the licence cost of GraphDagger many times over. GraphDagger improves your investigation quality and your speed. Making you better and faster.
Nothing leaves your machine
GraphDagger is not cloud-based. GraphDagger sends no telemetry, no analytics and no crash reports. Captures, tokens, logs and credentials are stored locally on your device, never on someone else's server. Safe and secure.
How does GraphDagger compare?
A fair question deserves a straight answer. Below is every tool in GraphDagger, the third-party apps it stands in for, and an honest account of how deep it goes.
Our approach is deliberate: for each tool we kept the capabilities engineers reach for daily and cut the obscure long tail, fewer rarely-used menus means you reach the common case faster. Some tools match the standalone apps feature for feature and add things none of them have in one place; one has no off-the-shelf equivalent at all. Where a specialist still goes deeper for a niche job, we say so plainly.
A Wireshark-style display filter language with real-time inspection across every protocol layer. We've trimmed Wireshark's rarely-touched dissector tail. For deep-forensics edge cases Wireshark still goes further, and we'll point you there rather than pretend otherwise.
Live HTTP/S capture with full request and response inspection, plus a rule engine with a dedicated DSL, request and response breakpoints, a JavaScript scripting engine, Map Local and Map Remote redirection, four capture modes (browser, terminal, remote device or explicit listener) and HAR import/export. Recorded traffic renders as a live call graph.
Build and send requests across every standard method with query, header and body editors, all body types (form-data, URL-encoded, raw with syntax highlighting, binary), folder-based collections, full history with replay, and side-by-side request tabs that keep independent state so two endpoints compare in one view.
Load Playwright and Chrome DevTools traces and replay a captured browser session frame by frame, with a browser snapshot synced to a scrubber, waterfall lanes for actions, network calls and console events, network timing and performance metrics, and full event search, all in one synchronised timeline.
Drop in an EML file or paste raw source to parse the full message: SPF, DKIM, DMARC, ARC and Authentication-Results scored with verdict badges and RFC references, the hop-by-hop routing chain laid out as server cards, a custom rule editor, and safe HTML preview with phishing-indicator detection. Header analysers like MXToolbox and PhishTool cover the authentication read; here it runs in the same session as your captures, logs and extracted IOCs.
Hex viewer, entropy heatmap and ASCII/Unicode string extraction, plus a full triage layer those hex editors don't have: a colour-coded risk score, PE metadata, archive and ZIP inspection, OCR, automated IOC extraction and a syntax-highlighted YARA rule editor. For heavy byte-level editing, a dedicated hex editor still wins.
Load logs as plain text, JSON, JSONL, CSV or gzip, extract structured fields with configurable parsers, then query across millions of rows in SQL or a field-based search. Faceted value counts, LogMine/Grok pattern grouping, transaction roll-ups and an interactive event-distribution timeline round it out. lnav and klogg do this on the terminal and desktop; here the same querying sits alongside every other tool in one investigation.
Dual-pane waveform and spectrogram with synced zoom and scroll, real-time FFT spectral analysis with configurable FFT size, window, colour map and frequency scale, a click-to-set spectrum inspector, and metadata for WAV, MP3, FLAC, OGG, AAC and M4A. Sonic Visualiser, Audacity and Spek go deeper on dedicated audio work; here it is signal-level forensics inside the same investigation.
A visual node canvas with 100+ operations across encoding, hashing, encryption, compression, networking and threat-intel, chained through input/output ports, previewed live with auto-bake, and saved or exported as reusable recipes. Includes IOC extraction CyberChef doesn't.
Far more than a JWT decoder: it auto-detects and handles JWTs, SAML responses, OAuth / OpenID Connect URLs and X.509 certificates, with Decode, Generate, Compare (field-level diff) and History modes, a security audit for weak algorithms, expiry and signature verification, and a token-lifespan timeline, all locally, with nothing pasted into a website.
A port scanner with service and OS detection, host discovery, timing controls, scan techniques and evasion, the Nmap options you actually use, plus DNS, WHOIS, SSL/TLS, email-security and traceroute lookups that run in parallel and stack into one report. More than Nmap alone covers.
Connect to SQLite, PostgreSQL, MySQL and SQL Server, several at once, and work through six tabs: visual schema with table and column structure, data browsing with inline cell editing, an auto-generated ERD, pragma config, a SQL editor with autocomplete and a timestamped query log. DBeaver-class clients go deeper on exotic engines and advanced tooling.
Drop in CSV, GeoJSON or TopoJSON and plot it on a Mapbox base map (light, dark, satellite or terrain), with nested layer groups and visibility toggles, drawing tools for polygons, lines and freehand shapes, on-canvas distance, area and bearing measurement, a feature-property inspector and a tabular data view. QGIS and kepler.gl go further on heavy GIS analysis; here it runs from IP geolocation through to full incident mapping without leaving the session.
Local, SSH and Windows RDP sessions in split panes, saved profiles, SFTP transfer, session recording, a searchable snippet library, SSH tunnels, broadcast-to-all-panes and command-guard rules, the whole job, in the same window as your capture and logs.
How to read this. This table is shorthand, a guide to how far each GraphDagger tool matches its third-party equivalents or goes beyond them. It isn't a feature-by-feature spec. For the full technical detail on any tool, see the Features and Docs sections. Where a tool has no third-party equivalent, it does something the separate-tools workflow simply couldn't, usually because it only becomes possible when everything shares one session.
Engineers save 6 hours a week or more
Saving 6 hours a week pays back the licence cost in less than 3 weeks. For many roles, the savings are greater.
Based on a UK 48 working week year. Salary benchmarks: £45,000 (£22/hr) and £55,000 (£27/hr) inclusive of employer on-costs (NI, pension, benefits estimated at ~20% above base).
Important caveat: Modelled estimate based on common multi-tool engineering workflows. Individual results vary by role and tool usage.
Time saving methodologyFor teams and organisations
Teams using GraphDagger make significant savings.
Licence cost paid back in under 3 weeks. A 21x return on the licence cost per year.
Licence cost paid back in under 2 weeks. A 27x return on the licence cost per year.
Based on a £22 hourly rate and a £1,500 team licence (5 x £300). If hourly rates are higher, the savings are greater. Team figures are five times the individual figures above.
GraphDagger stops the endless pain of:
- Switching applications
- Copying and pasting between tools
- Reformatting data
- Exporting and importing files
- Losing investigation context
- Searching for the right window
- Recreating the same connection, session or request in multiple apps
GraphDagger stops all of it, because it keeps the whole workflow in one place.
Stop the irritation of managing multiple third party tools
Lots of third party tools means lots of these to manage:
- Licence renewals
- Update prompts that arrive at different times
- Version mismatches across team members
- Reinstallation on a new or reimaged machine
- Security approval processes for cloud-based tools
It is irritating, it is inconvenient and it wastes even more valuable time. GraphDagger stops all of it.
Exceptional value
One signed app in place of a stack of separate tools, and it costs less than five of the apps it replaces.
Postman, Charles, Termius Pro, TablePlus, 010 Editor. Five of the apps it replaces.
All 14 tools in one signed app.
For enterprise volume pricing, contact support@graphdagger.com.
Third-party prices as of 2026.
From the team
We're engineers, like you.
We troubleshoot complex issues every day. And we got sick of doing it across a dozen different tools, tabbing between apps, copying values from one into another, losing the thread of an investigation halfway through.
We looked for one app that did it all. There wasn't one. So we built it.
We matched the tools you already use, and deliberately left out the obscure features engineers never touch. We didn't want something bloated and unwieldy, we wanted something streamlined. A few of the tools do things we couldn't find anywhere else.
The result is GraphDagger: a desktop investigation workspace with 14 tools in one app, built so you can stay in one window instead of twelve.
We're proud of it, and we hope you'll make it yours.
The engineers at GraphDagger
What engineers say
I look at emails and mail servers all day. The inspector in email forensics surfaces misconfigurations straight away, and I can keep a dozen messages open in tabs instead of losing my place every time something looks off.
Esat YamanEmail Security Engineer Honestly I mostly live in the capture tool and the terminal. Having them in the same window sounds like a small thing until you've had eight tabs open at 2am.
Priya NairIT Support Lead We can't send traffic to anyone else's cloud, which kills most tools before I've even tried them. This one doesn't, so it's the one I use.
Marcus FeldDevOps Engineer