Audio Inspector
Analyse audio files: waveform and spectrogram views, plus decoders that pull hidden content out of the signal.
See the whole file at once
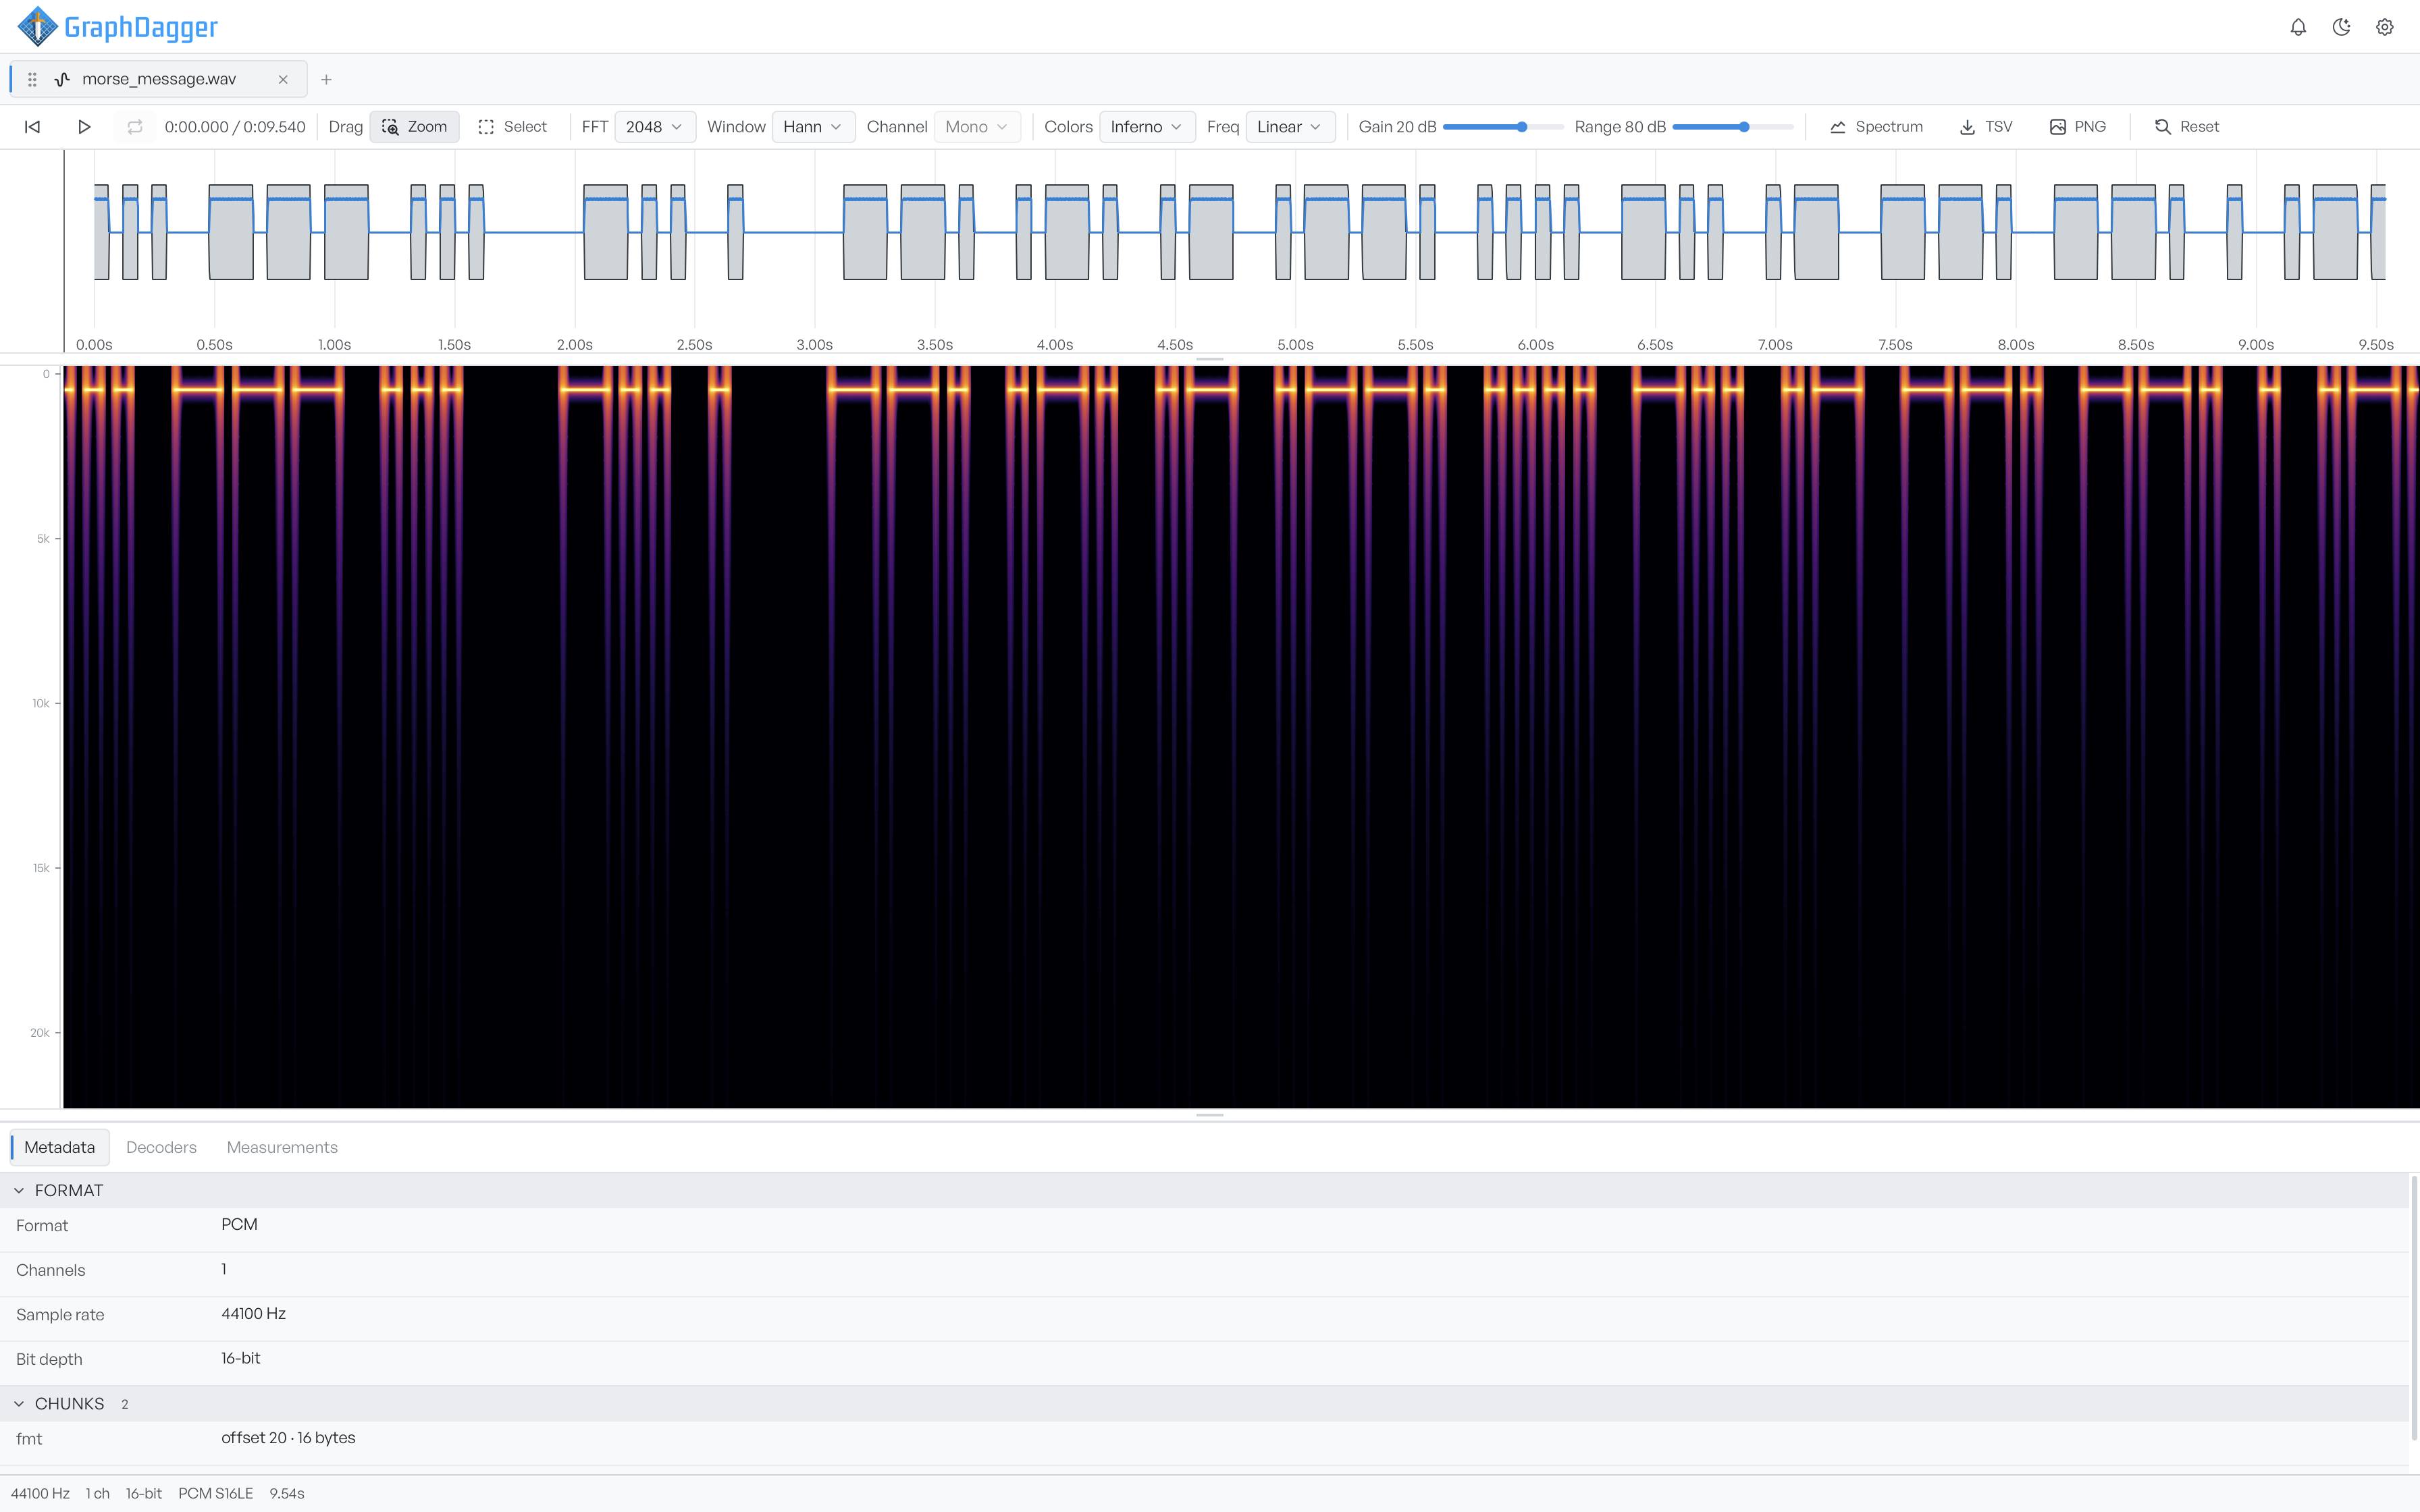
Load a recording and the workspace draws it two ways at the same time: a waveform strip showing loudness over time and a spectrogram showing which frequencies are present at each moment. Both views share one time range, so zooming one moves the other, and the Analysis panel below turns what you can see into something you can read.
- Synchronised waveform and spectrogram over one shared time range
- Docked Analysis panel with Metadata, Decoders and Measurements tabs
- Status bar reporting sample rate, channels, bit depth, codec and duration

Decode what the audio is carrying
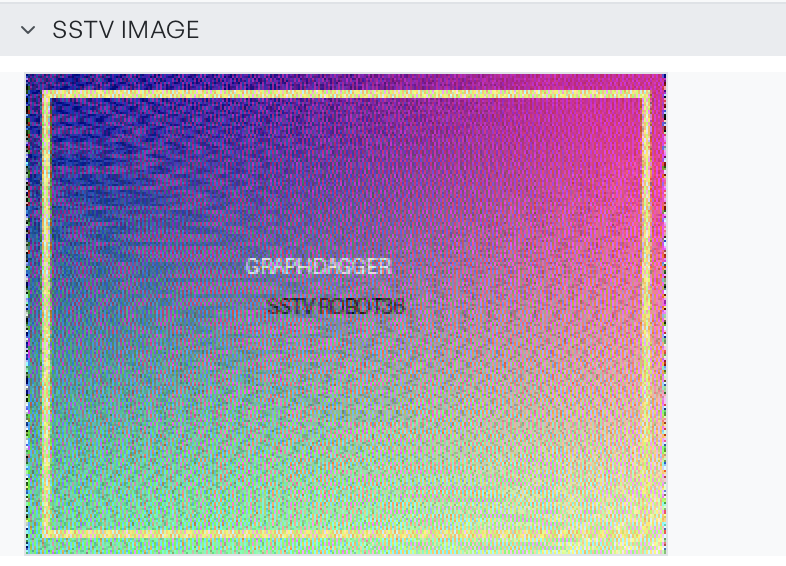
Some audio is not meant to be listened to. Select a region on the spectrogram, run a decoder and read the result: DTMF returns the dialled digits, Morse returns the keyed text, SSTV rebuilds a transmitted picture line by line, and LSB extract reads a payload hidden in the low bits of PCM WAV samples.
- SSTV decoding across seven modes: Martin, Scottie, Robot and PD 120
- LSB extract with selectable channel and one to four bits per sample
- Decoders run over your selection, or the whole file with nothing selected
Read the container before you trust the signal
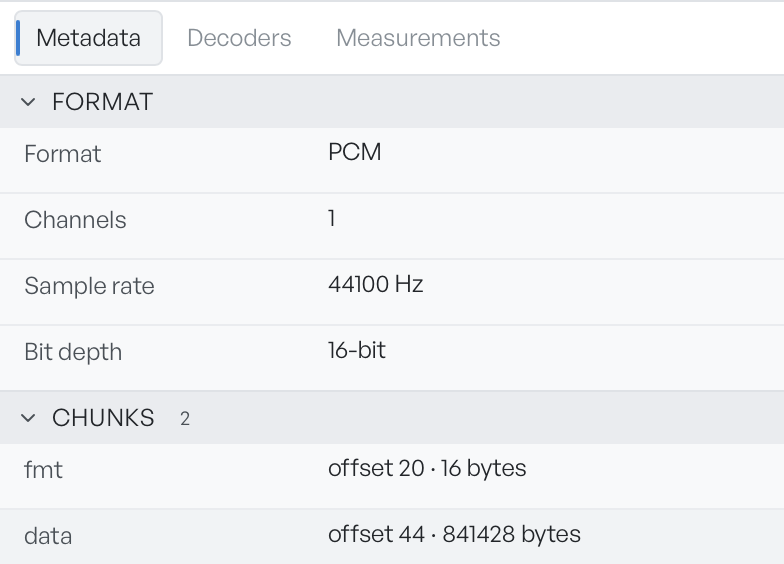
A file that sounds ordinary can still be structurally wrong. The Metadata tab runs on its own the moment a file opens: it walks the container structure, lists every chunk with its offset and size, reports the claimed format and flags structural anomalies before you spend time on the signal. A chunk you do not recognise, or one far larger than its contents justify, is a good place to go looking for hidden bytes.
- Anomalies surfaced first, only when there is something to report
- Format claims you can compare against what the decoder produced
- Embedded metadata tags left by recorders and editing tools
Tune the view until the signal stands out
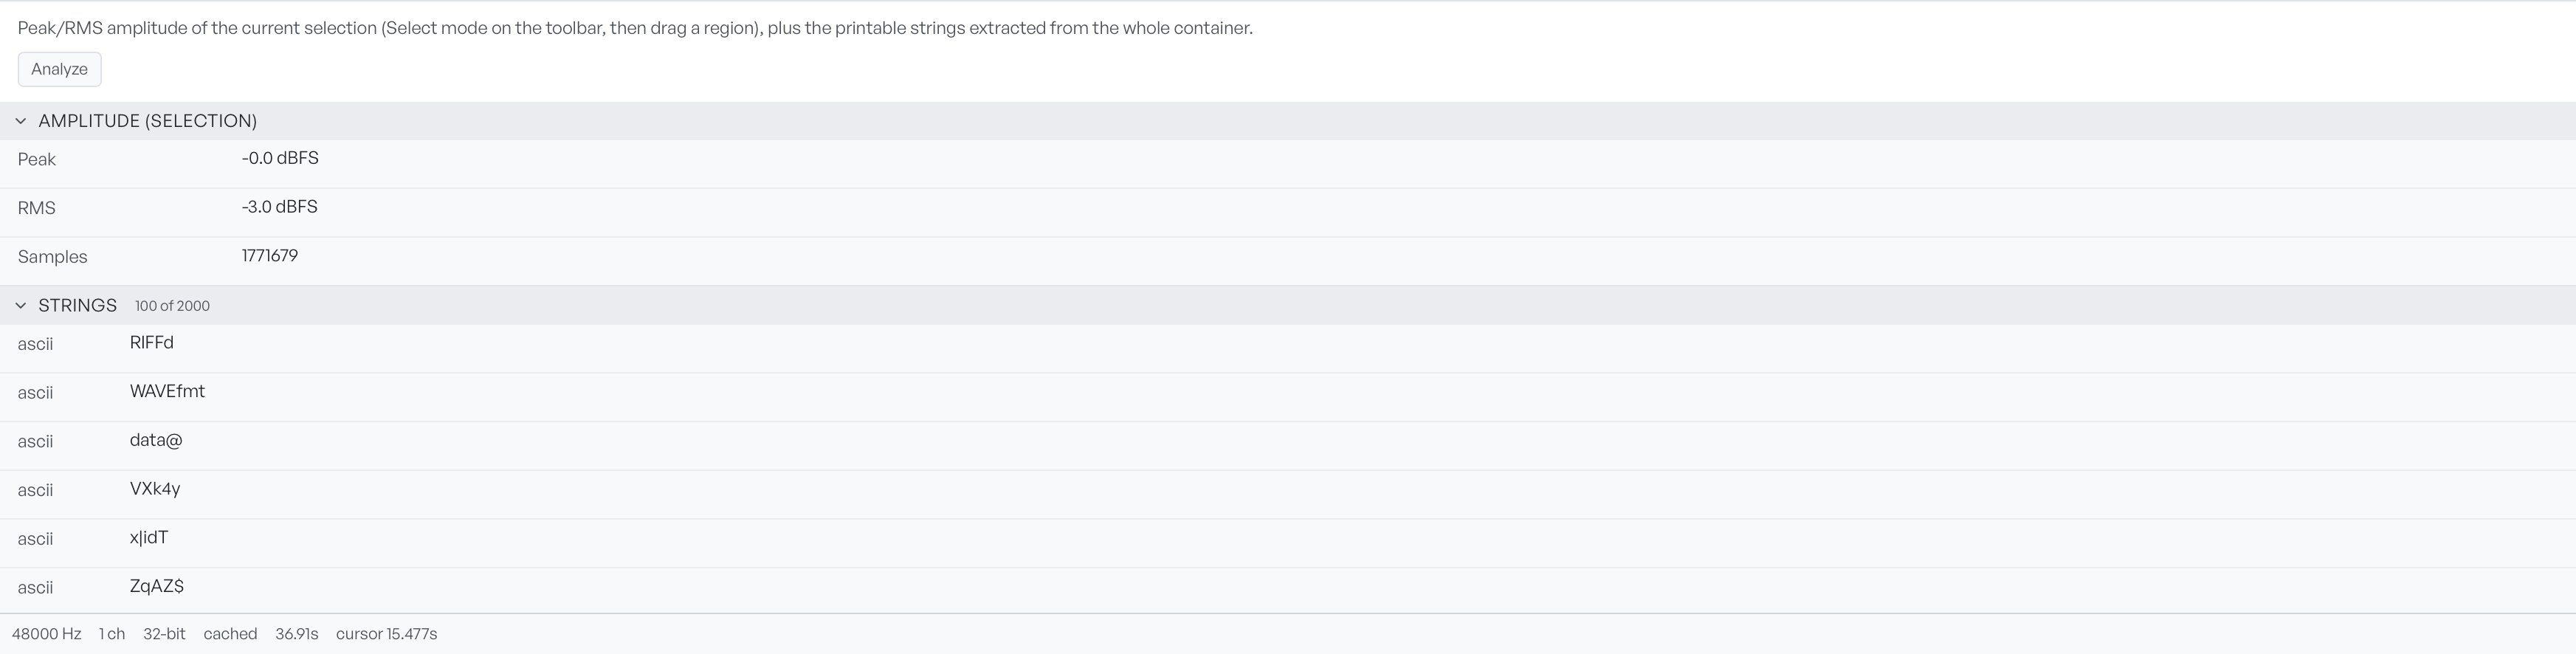
The toolbar splits into analysis controls and display controls. FFT size from 512 to 8192 and a choice of Hann, Hamming, Blackman or Rectangular windows change how the audio is analysed; colour map, frequency scale, gain and range change how it is drawn. Narrow the range to isolate a strong signal, widen it to bring up something kept deliberately quiet, then export the spectrogram or spectrum straight from the toolbar. WAV, MP3, FLAC, OGG, AAC and M4A files are all accepted.
- FFT size and window selection with per-channel analysis
- Inferno, Viridis, Magma, Plasma and Greys colour maps
- Linear, log and mel frequency scales with gain and range sliders
- Opens WAV, MP3, FLAC, OGG, AAC and M4A files
