Log Explorer
Parse and analyse application logs: structured field extraction, filtering and pattern detection.
One workspace for the whole file
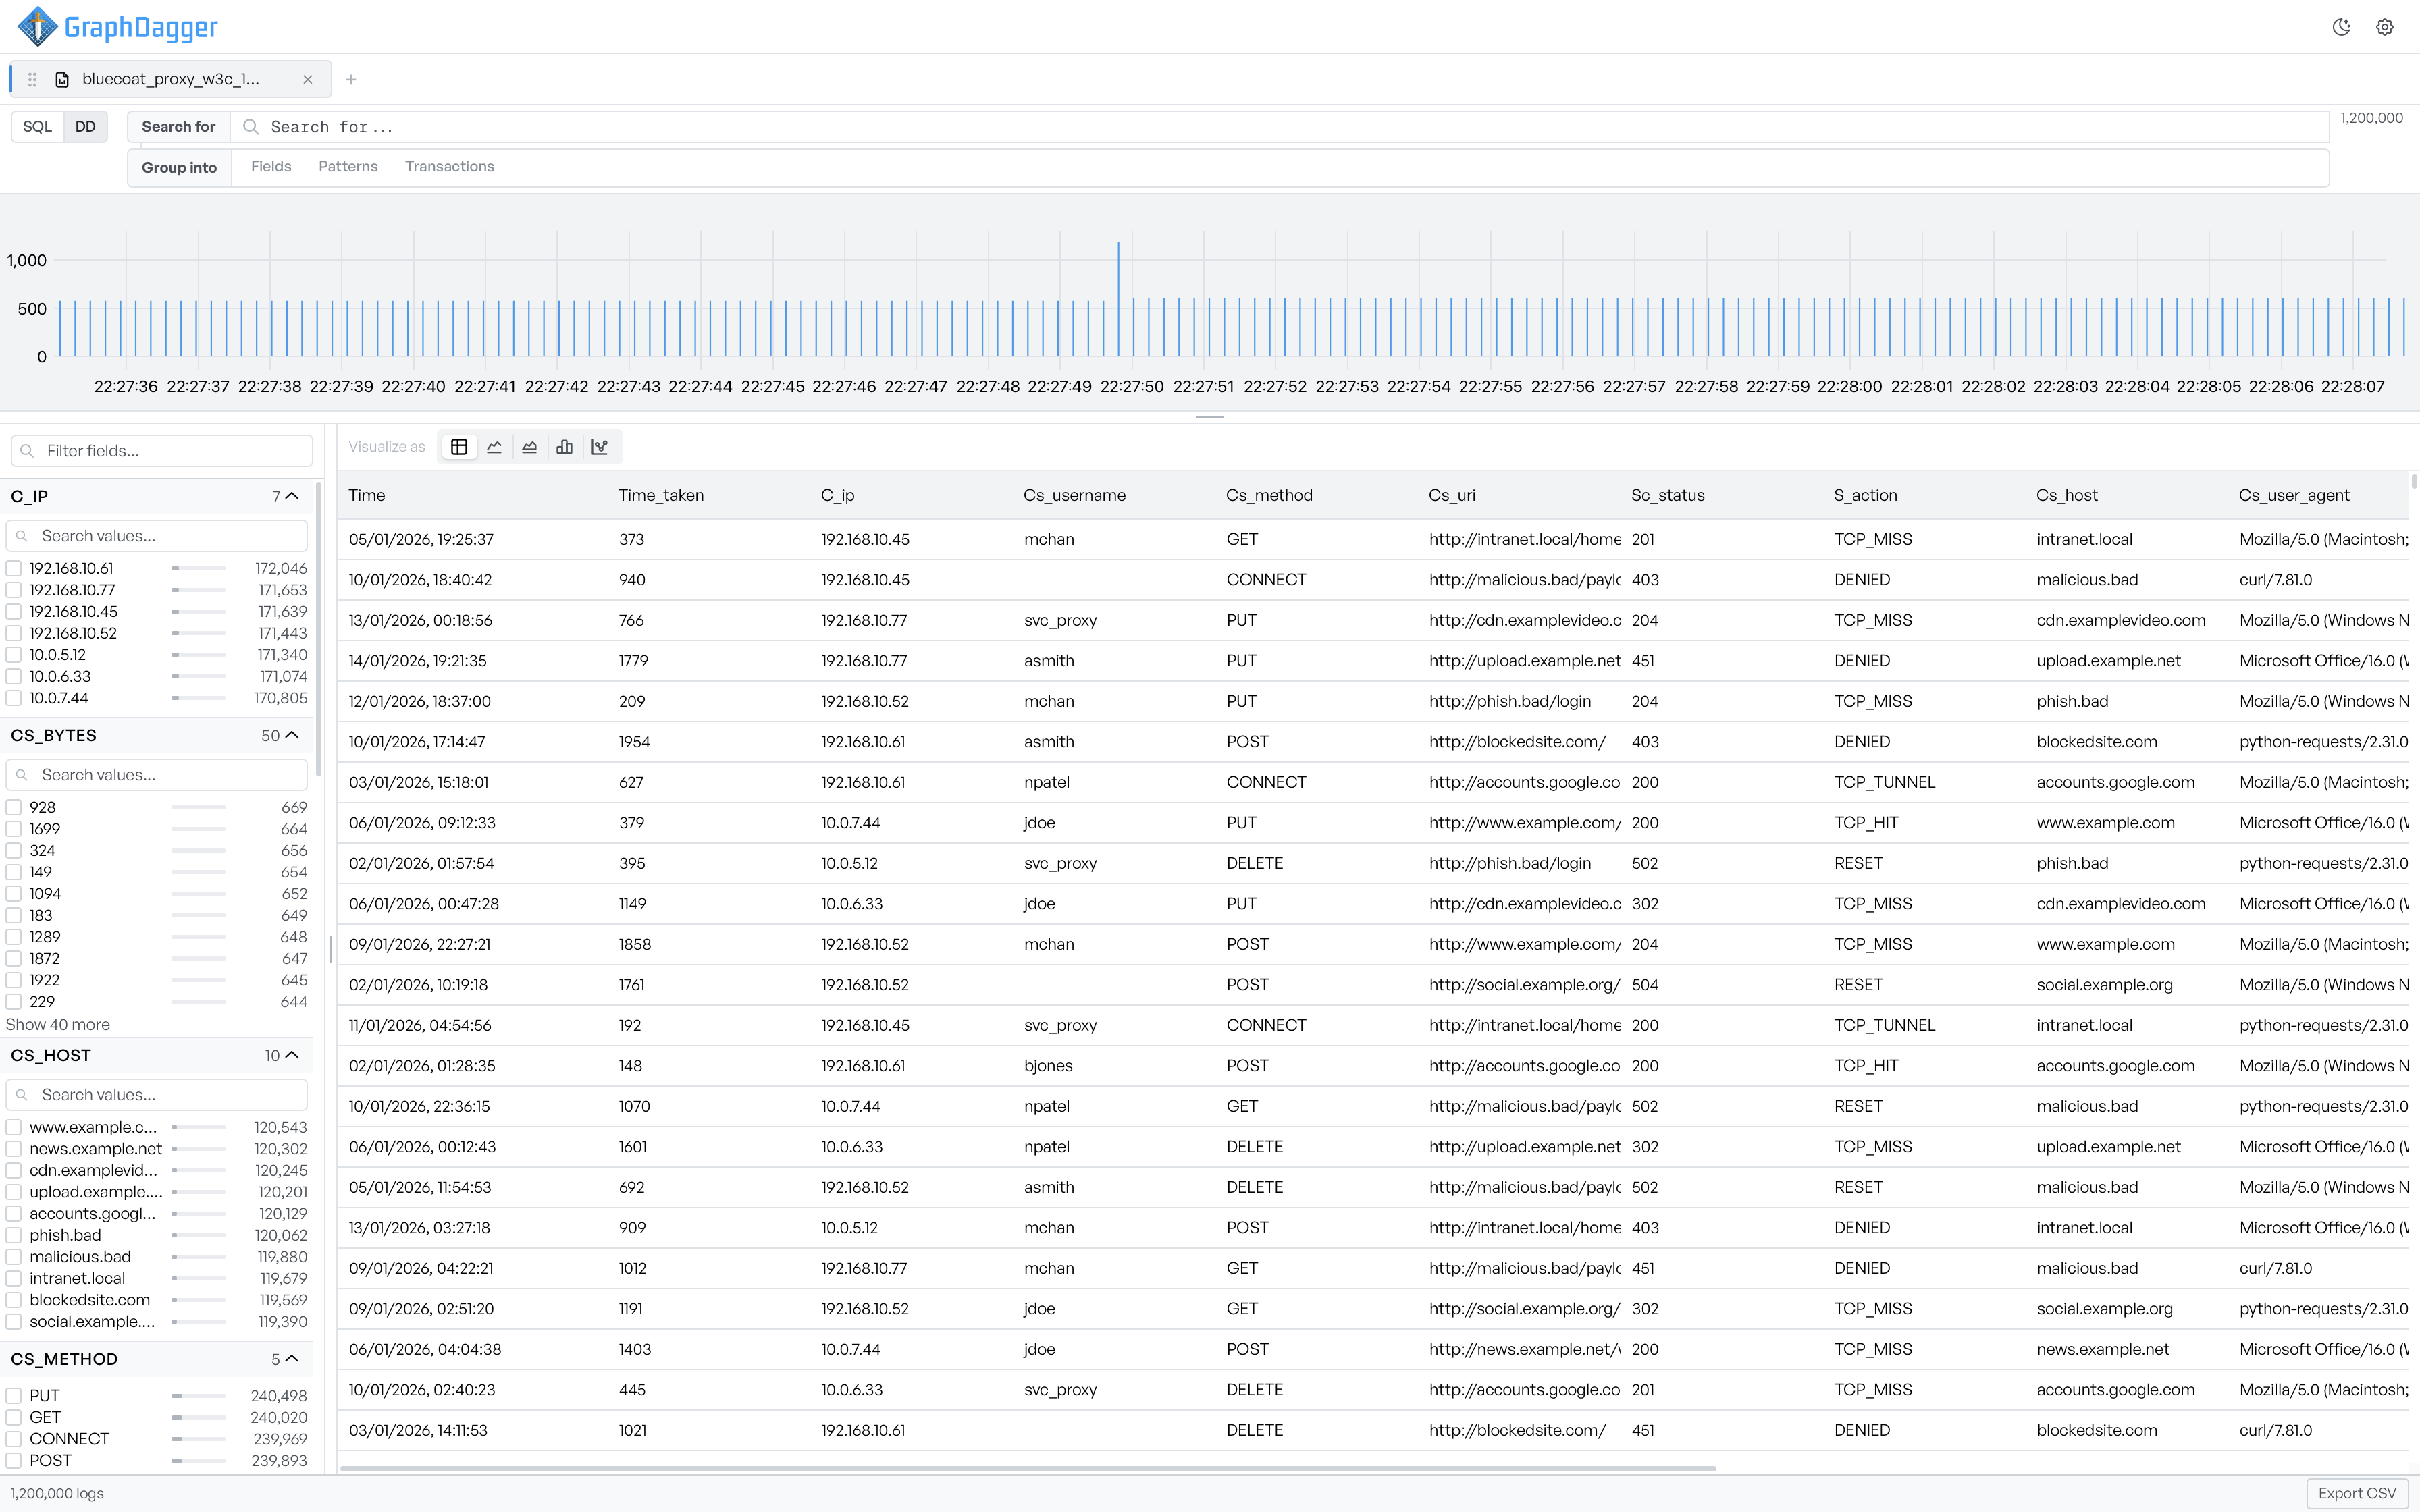
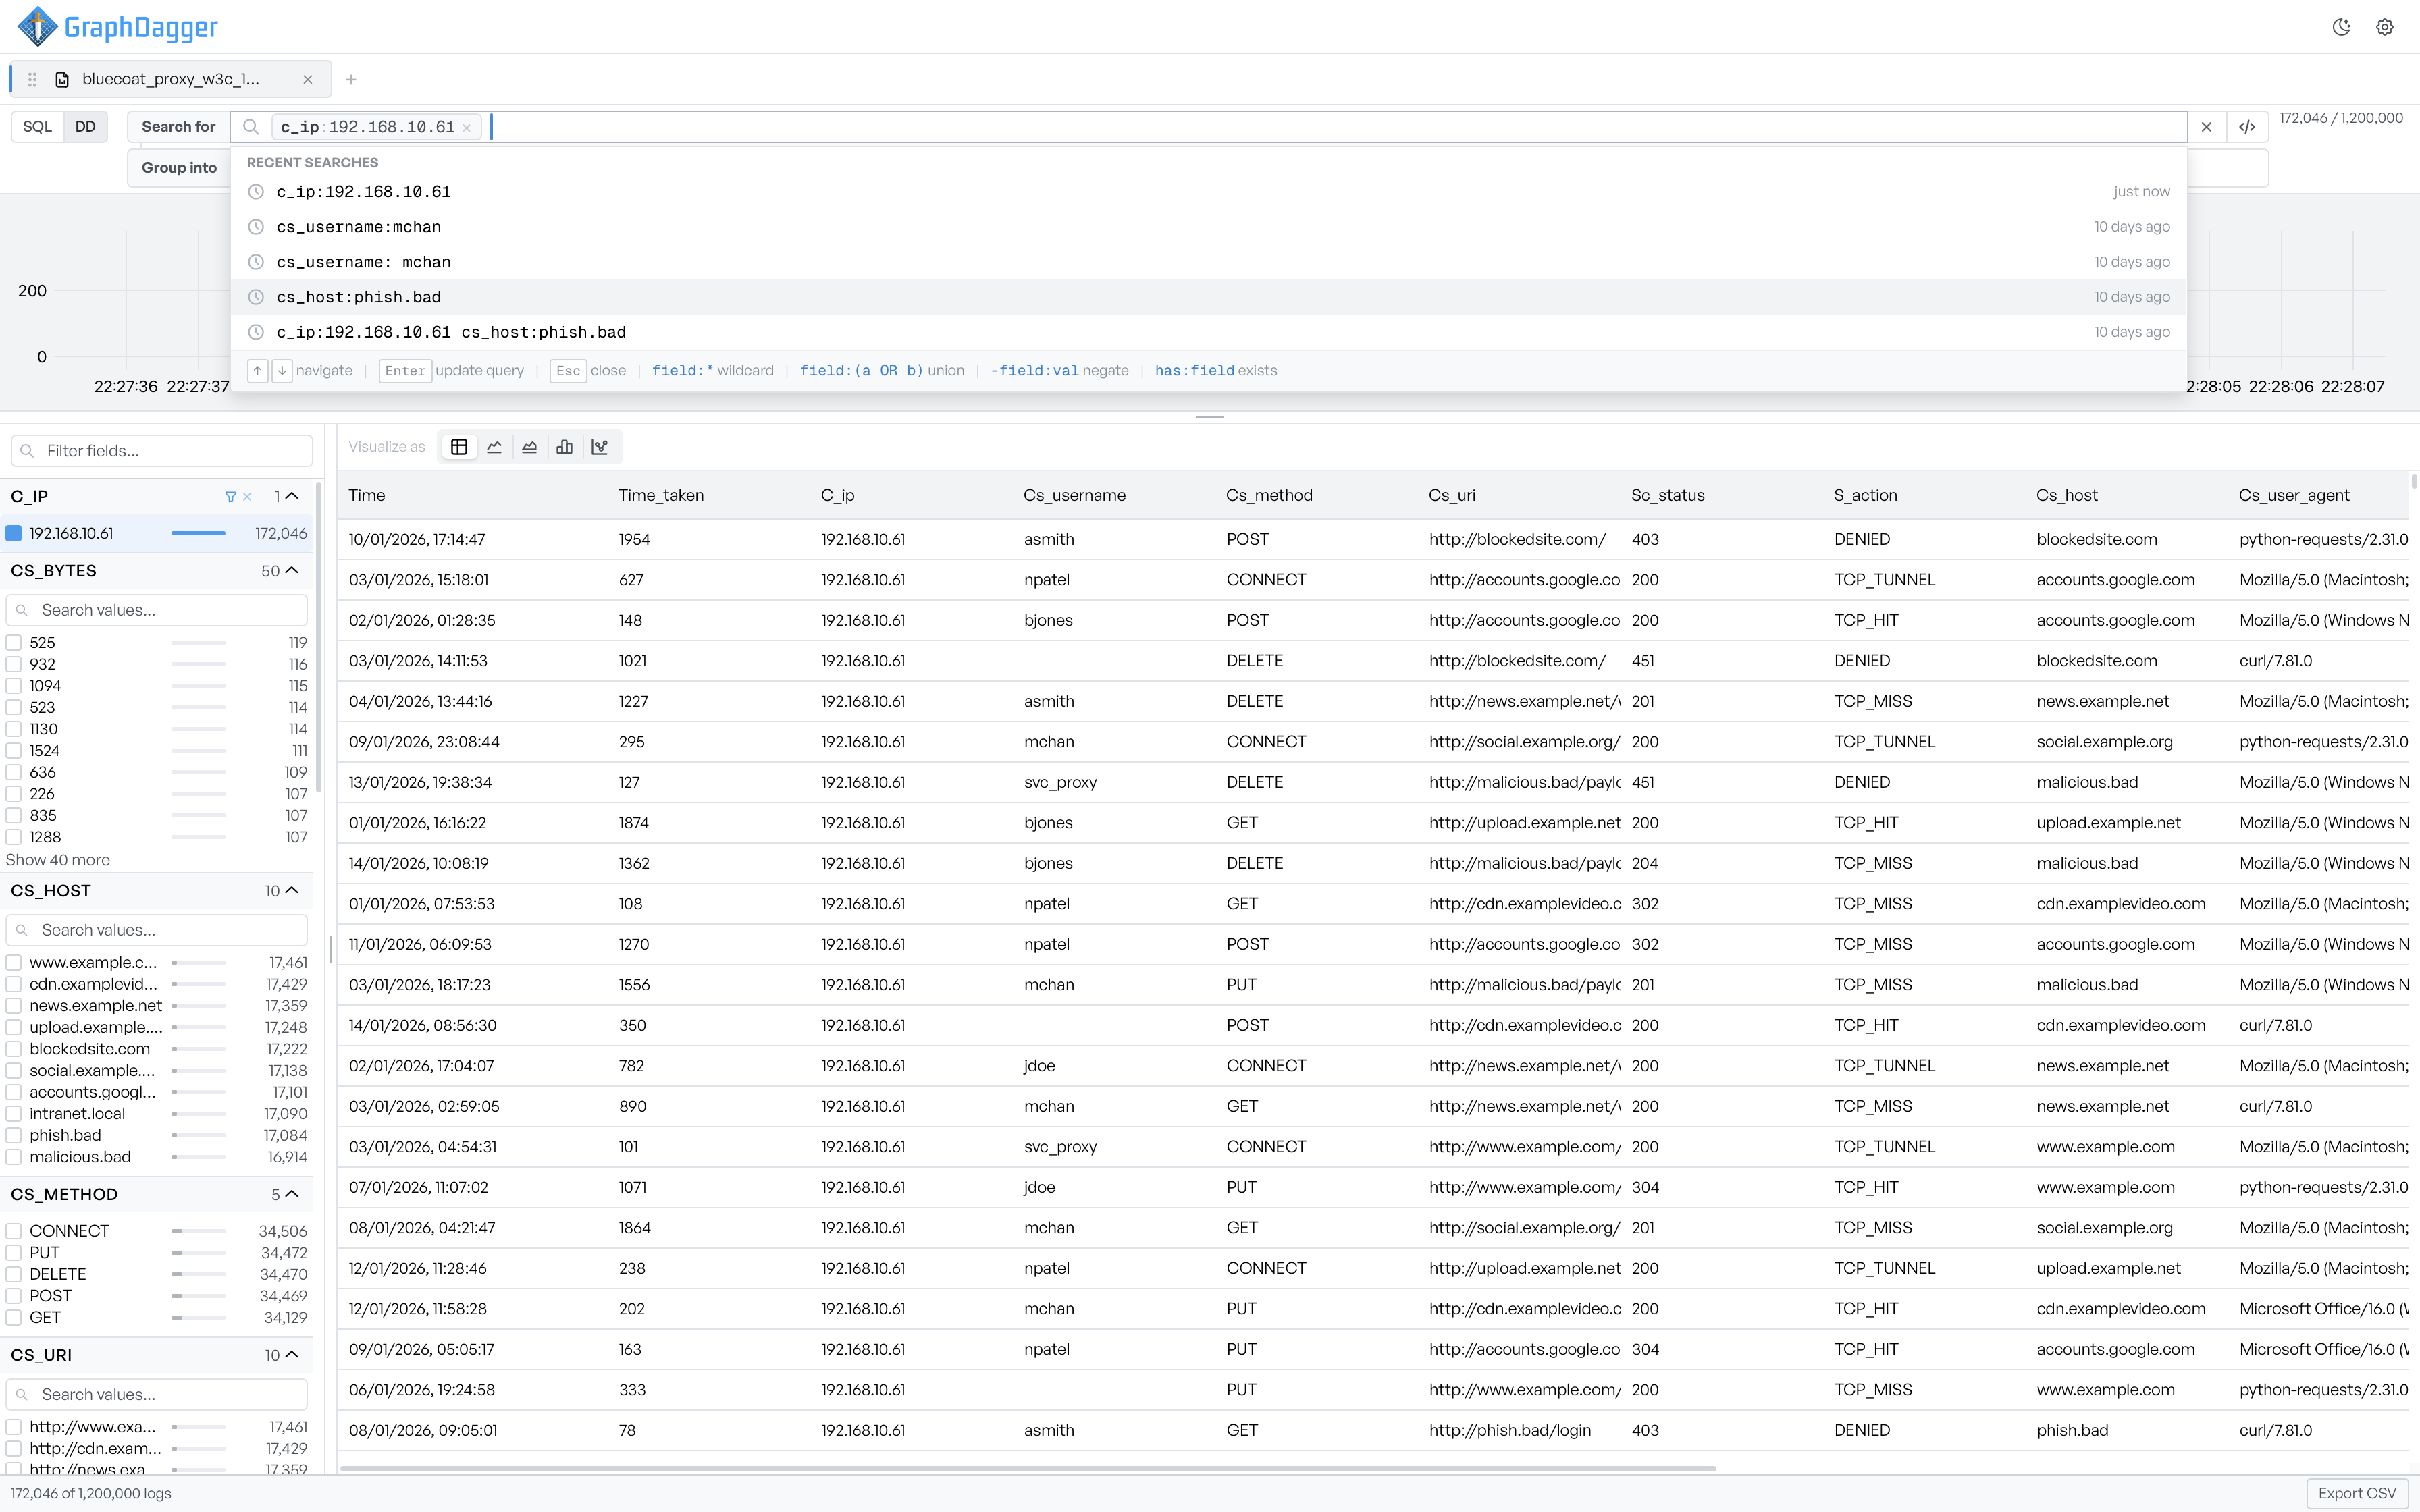
Drop a log file in and four coordinated regions respond to every query: a search bar, an activity histogram, a facets panel and an events table. The facets list every parsed field with its distinct values and per-row counts, so a 1.2 million row proxy log becomes something you can read rather than scroll.
- Activity histogram that redraws live as the query changes
- Facets panel with distinct values and row counts per field
- Filtered against total counts, for example 172,046 of 1,200,000
Filter, group and chart in one pass
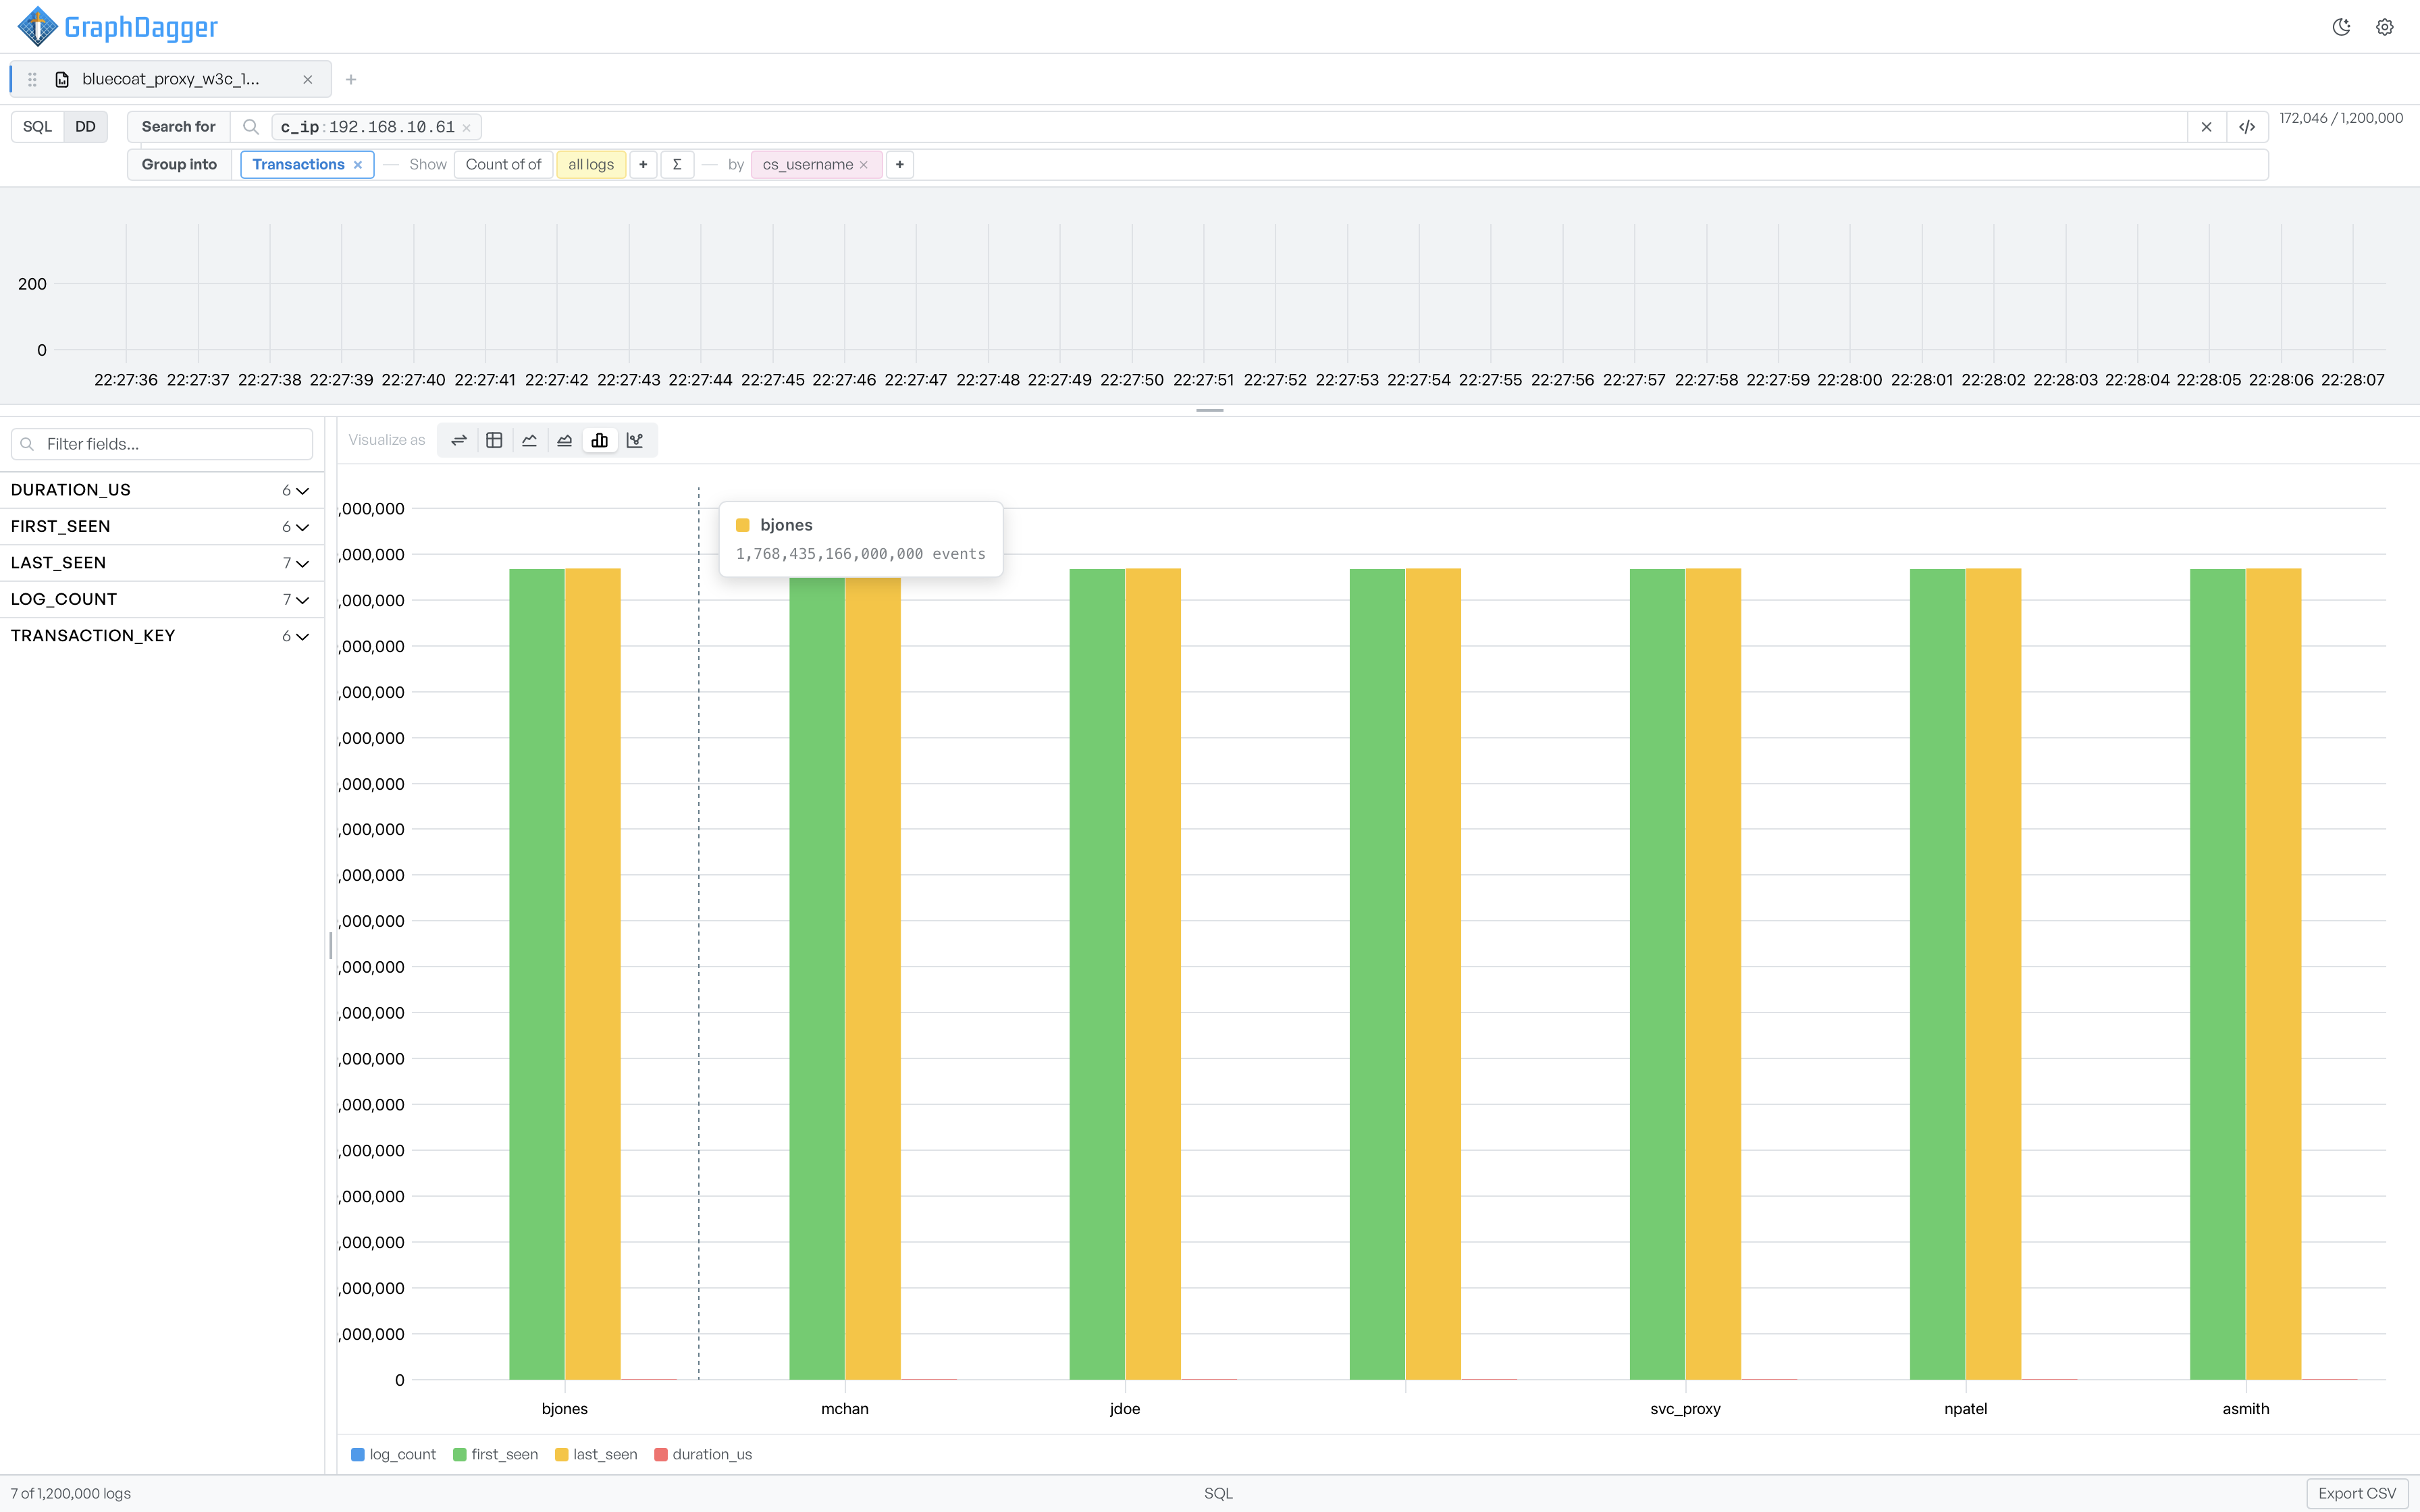
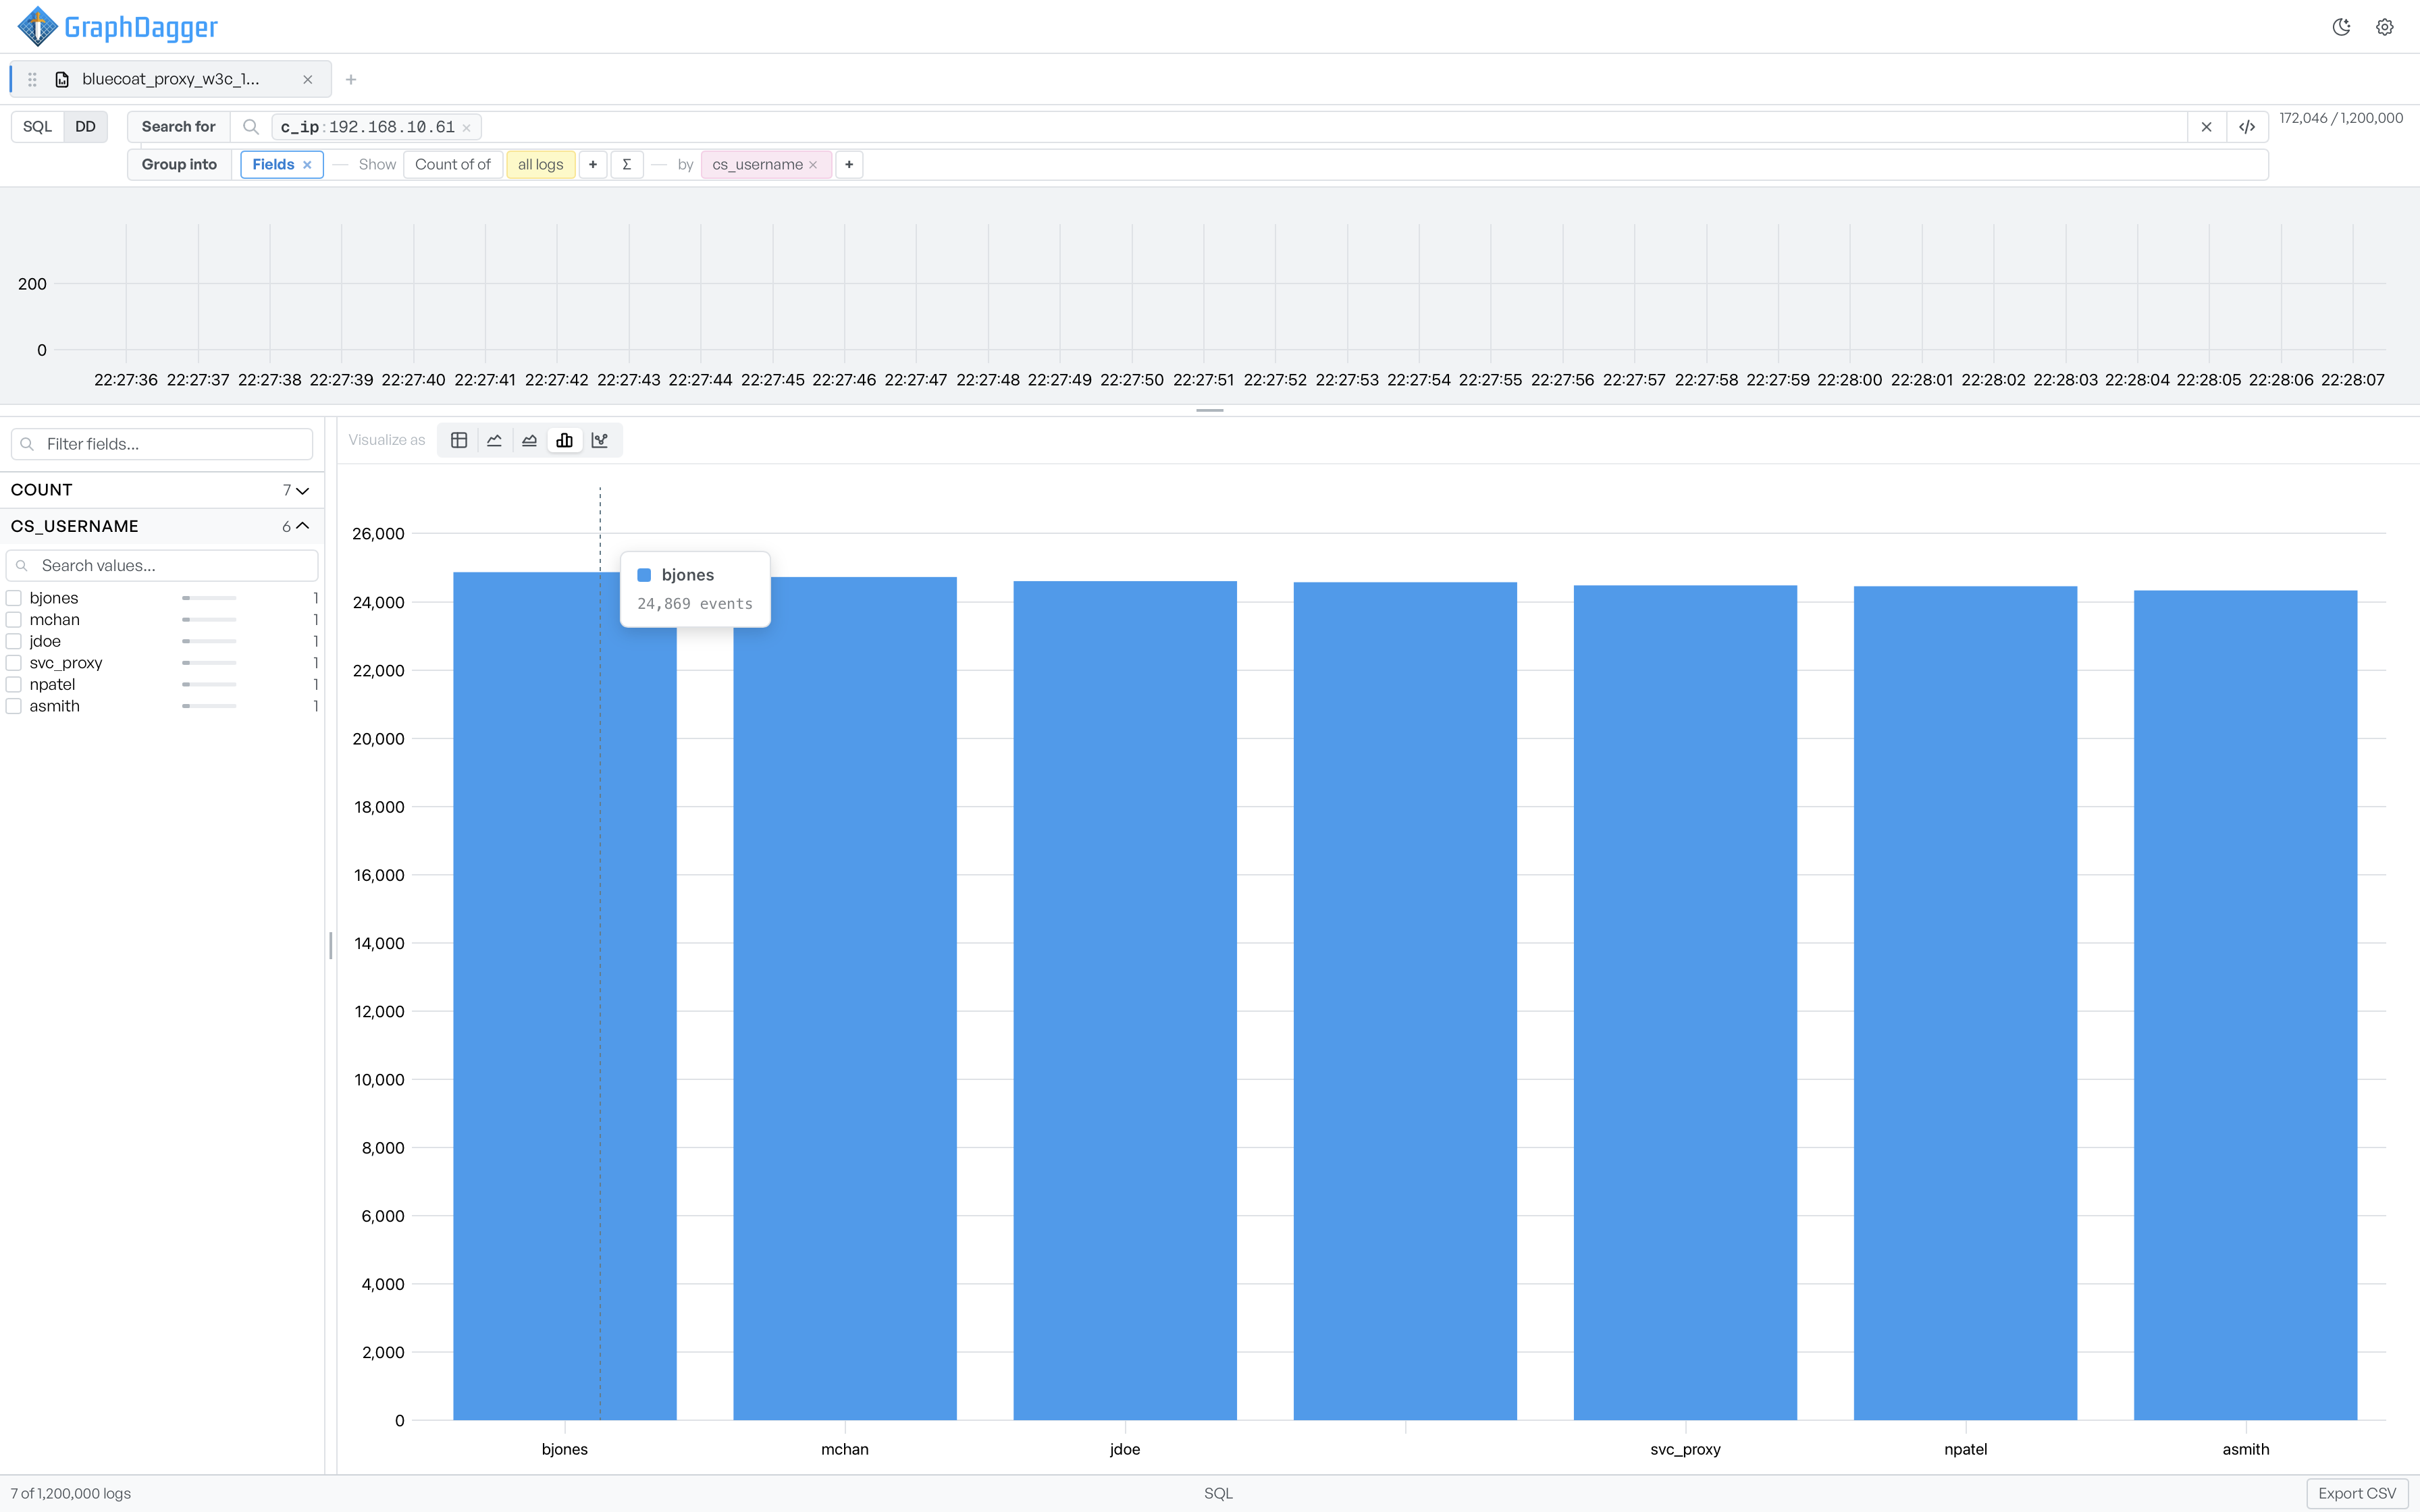
Type a filter like c_ip:192.168.10.61, group the surviving rows by any field and render the result as a table, line, area, bar or scatter chart. The same aggregation redraws into every chart type without re-running the query, and hovering a bar reads out the group and its exact count.
- field:value syntax with OR groups, negation and has: checks
- Count, sum, average, minimum or maximum over any numeric field
- Transactions roll-up with duration, first seen and last seen per key
Find the shapes hiding in the lines
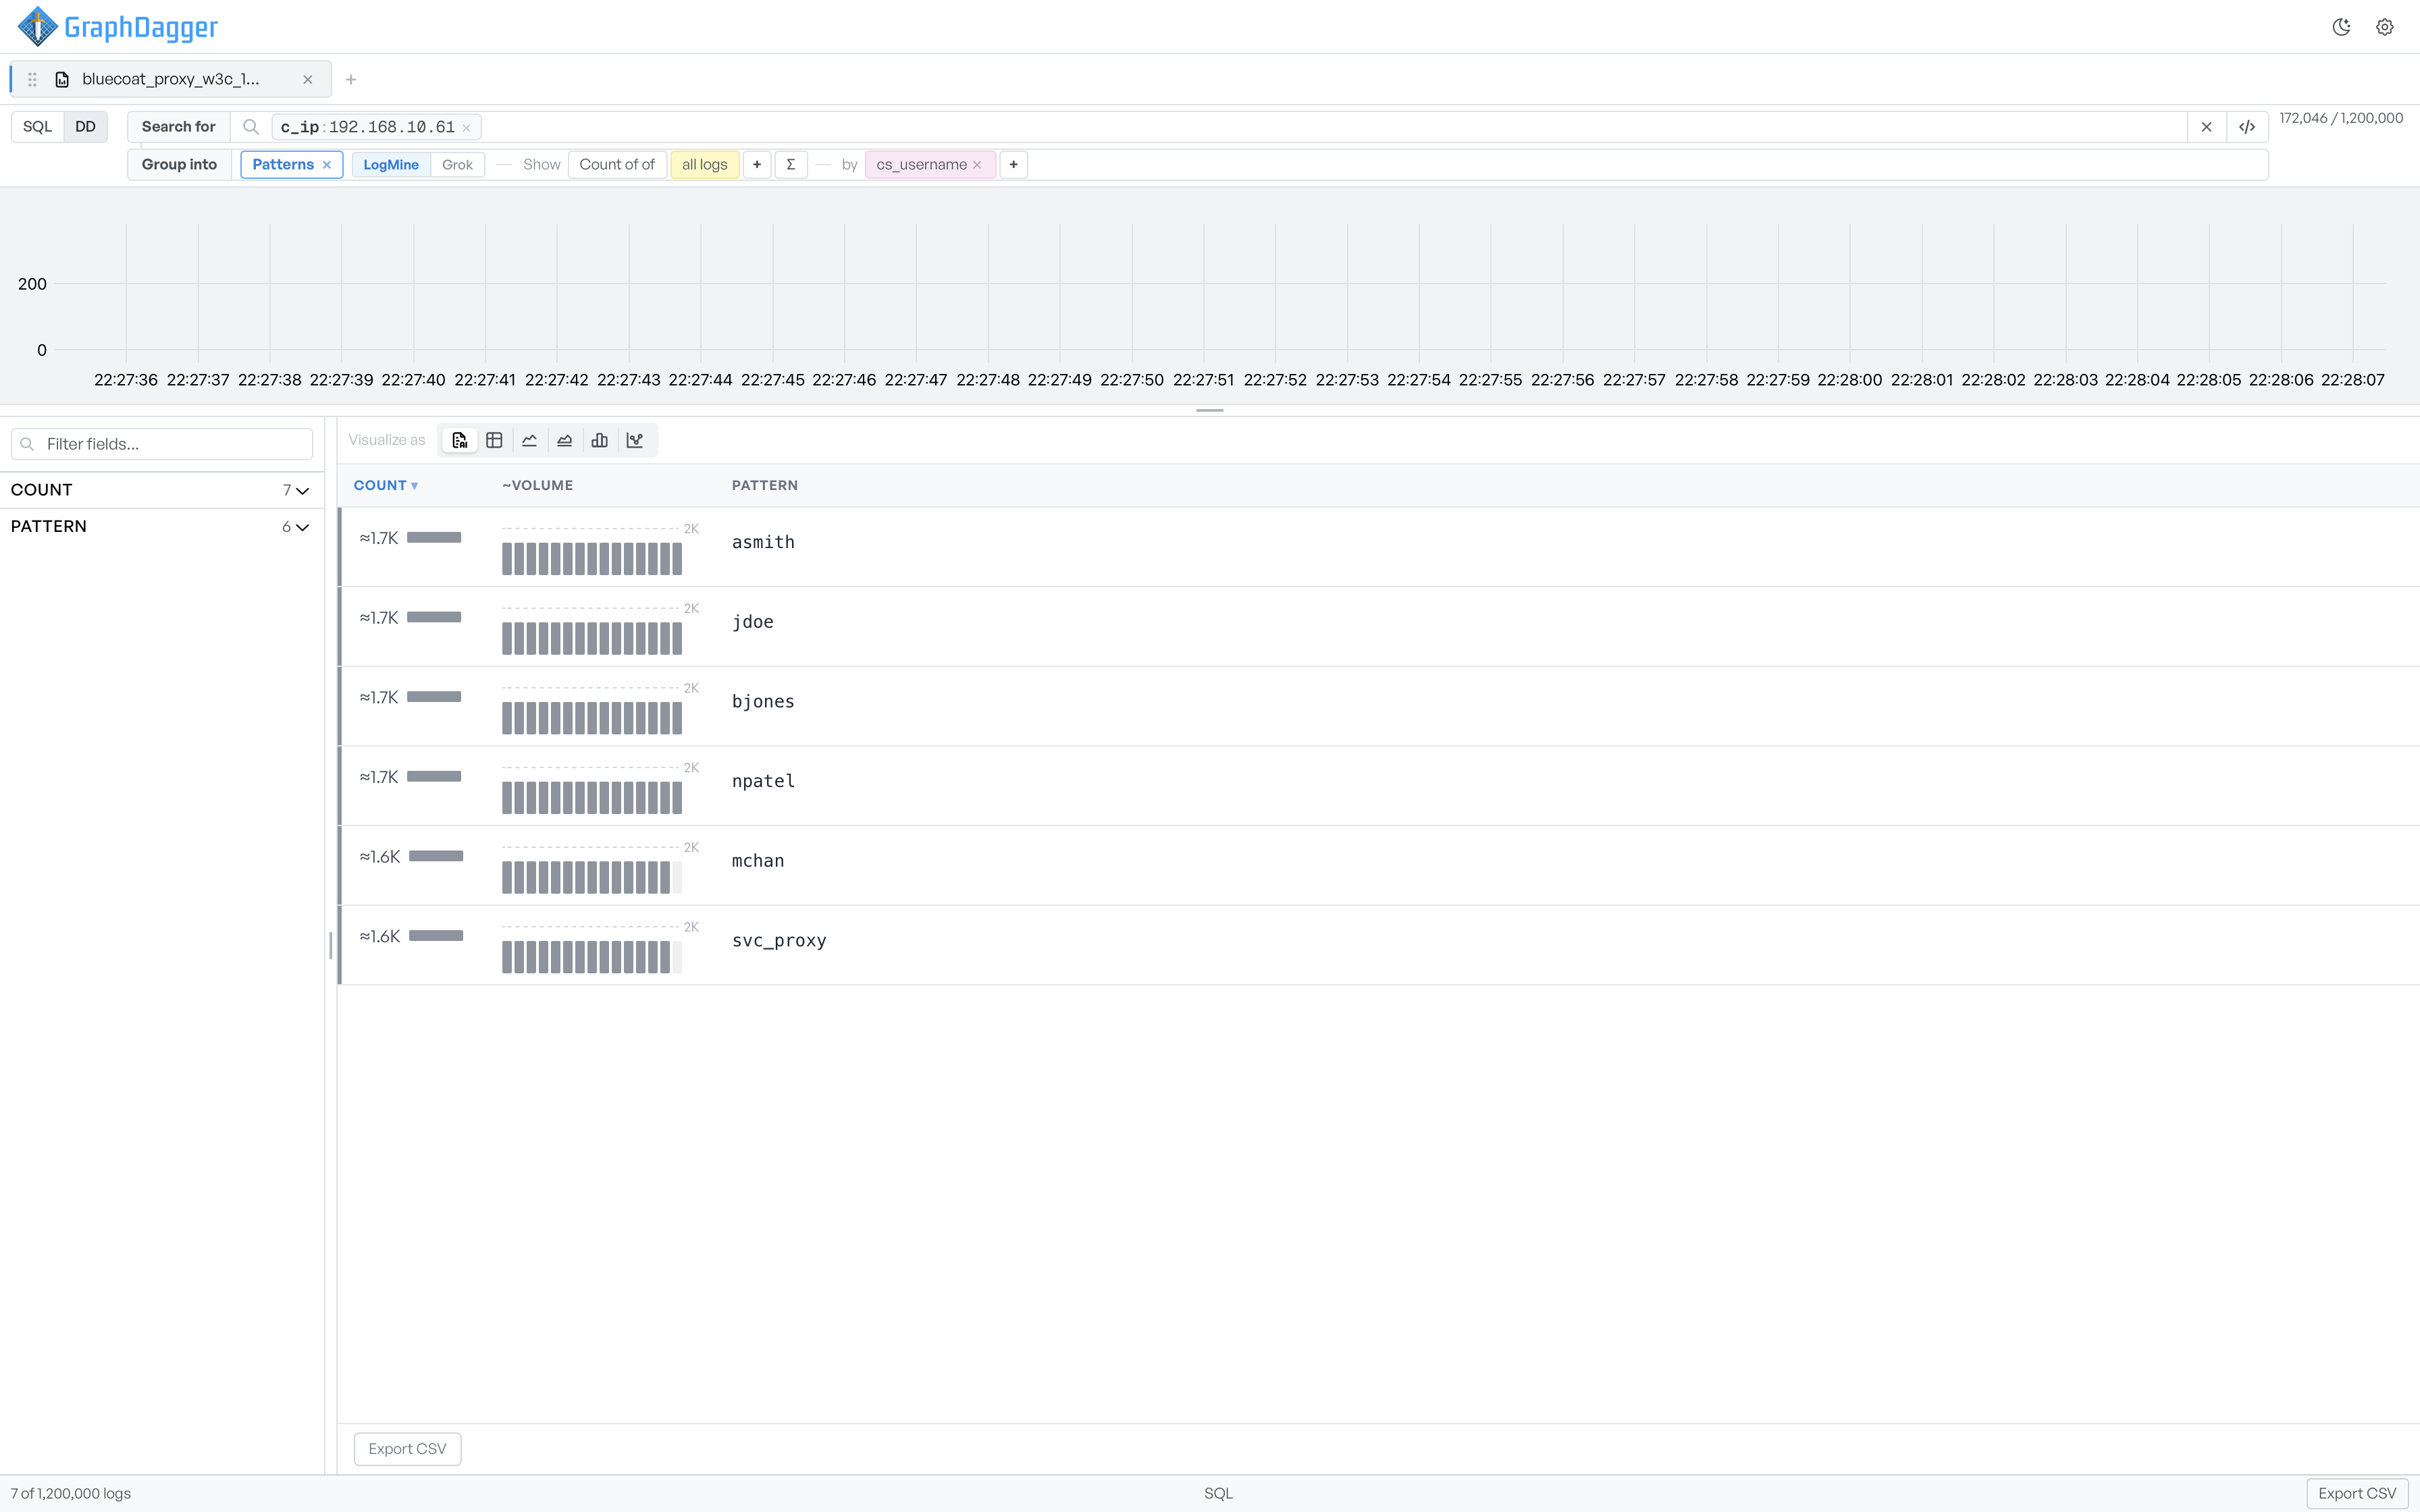
Switch Group into to Patterns and LogMine discovers the repeating templates in the file for you, replacing the parts that vary with placeholders and counting how many rows each shape covers. The rare templates are where the unusual lines live. When you already know the format, apply a Grok pattern instead and the named captures become ordinary columns you can facet and group.
- LogMine template discovery with per-pattern counts and sparklines
- Grok patterns with a standard library of building blocks
- Selecting a pattern narrows every region to its matching rows
Built for big, messy files
Compressed .gz and .zip logs open directly, and files stream in as they are read, so you can start querying before a multi-gigabyte file has finished loading. Log Explorer detects common formats on sight, including W3C extended, JSON lines, CSV, TSV and syslog-style text, and a toggle switches the query bar between structured field search and full SQL. Everything is parsed and indexed on your machine, and the current rows export to CSV.
- Automatic decompression and streaming parse of large files
- Format detection for W3C, JSON lines, delimited text and syslog
- SQL and structured search modes, with CSV export of any result