Geo Map
Visualise geographic data on interactive maps: layer management, filtering and coordinate search.
Plot data and read what it holds
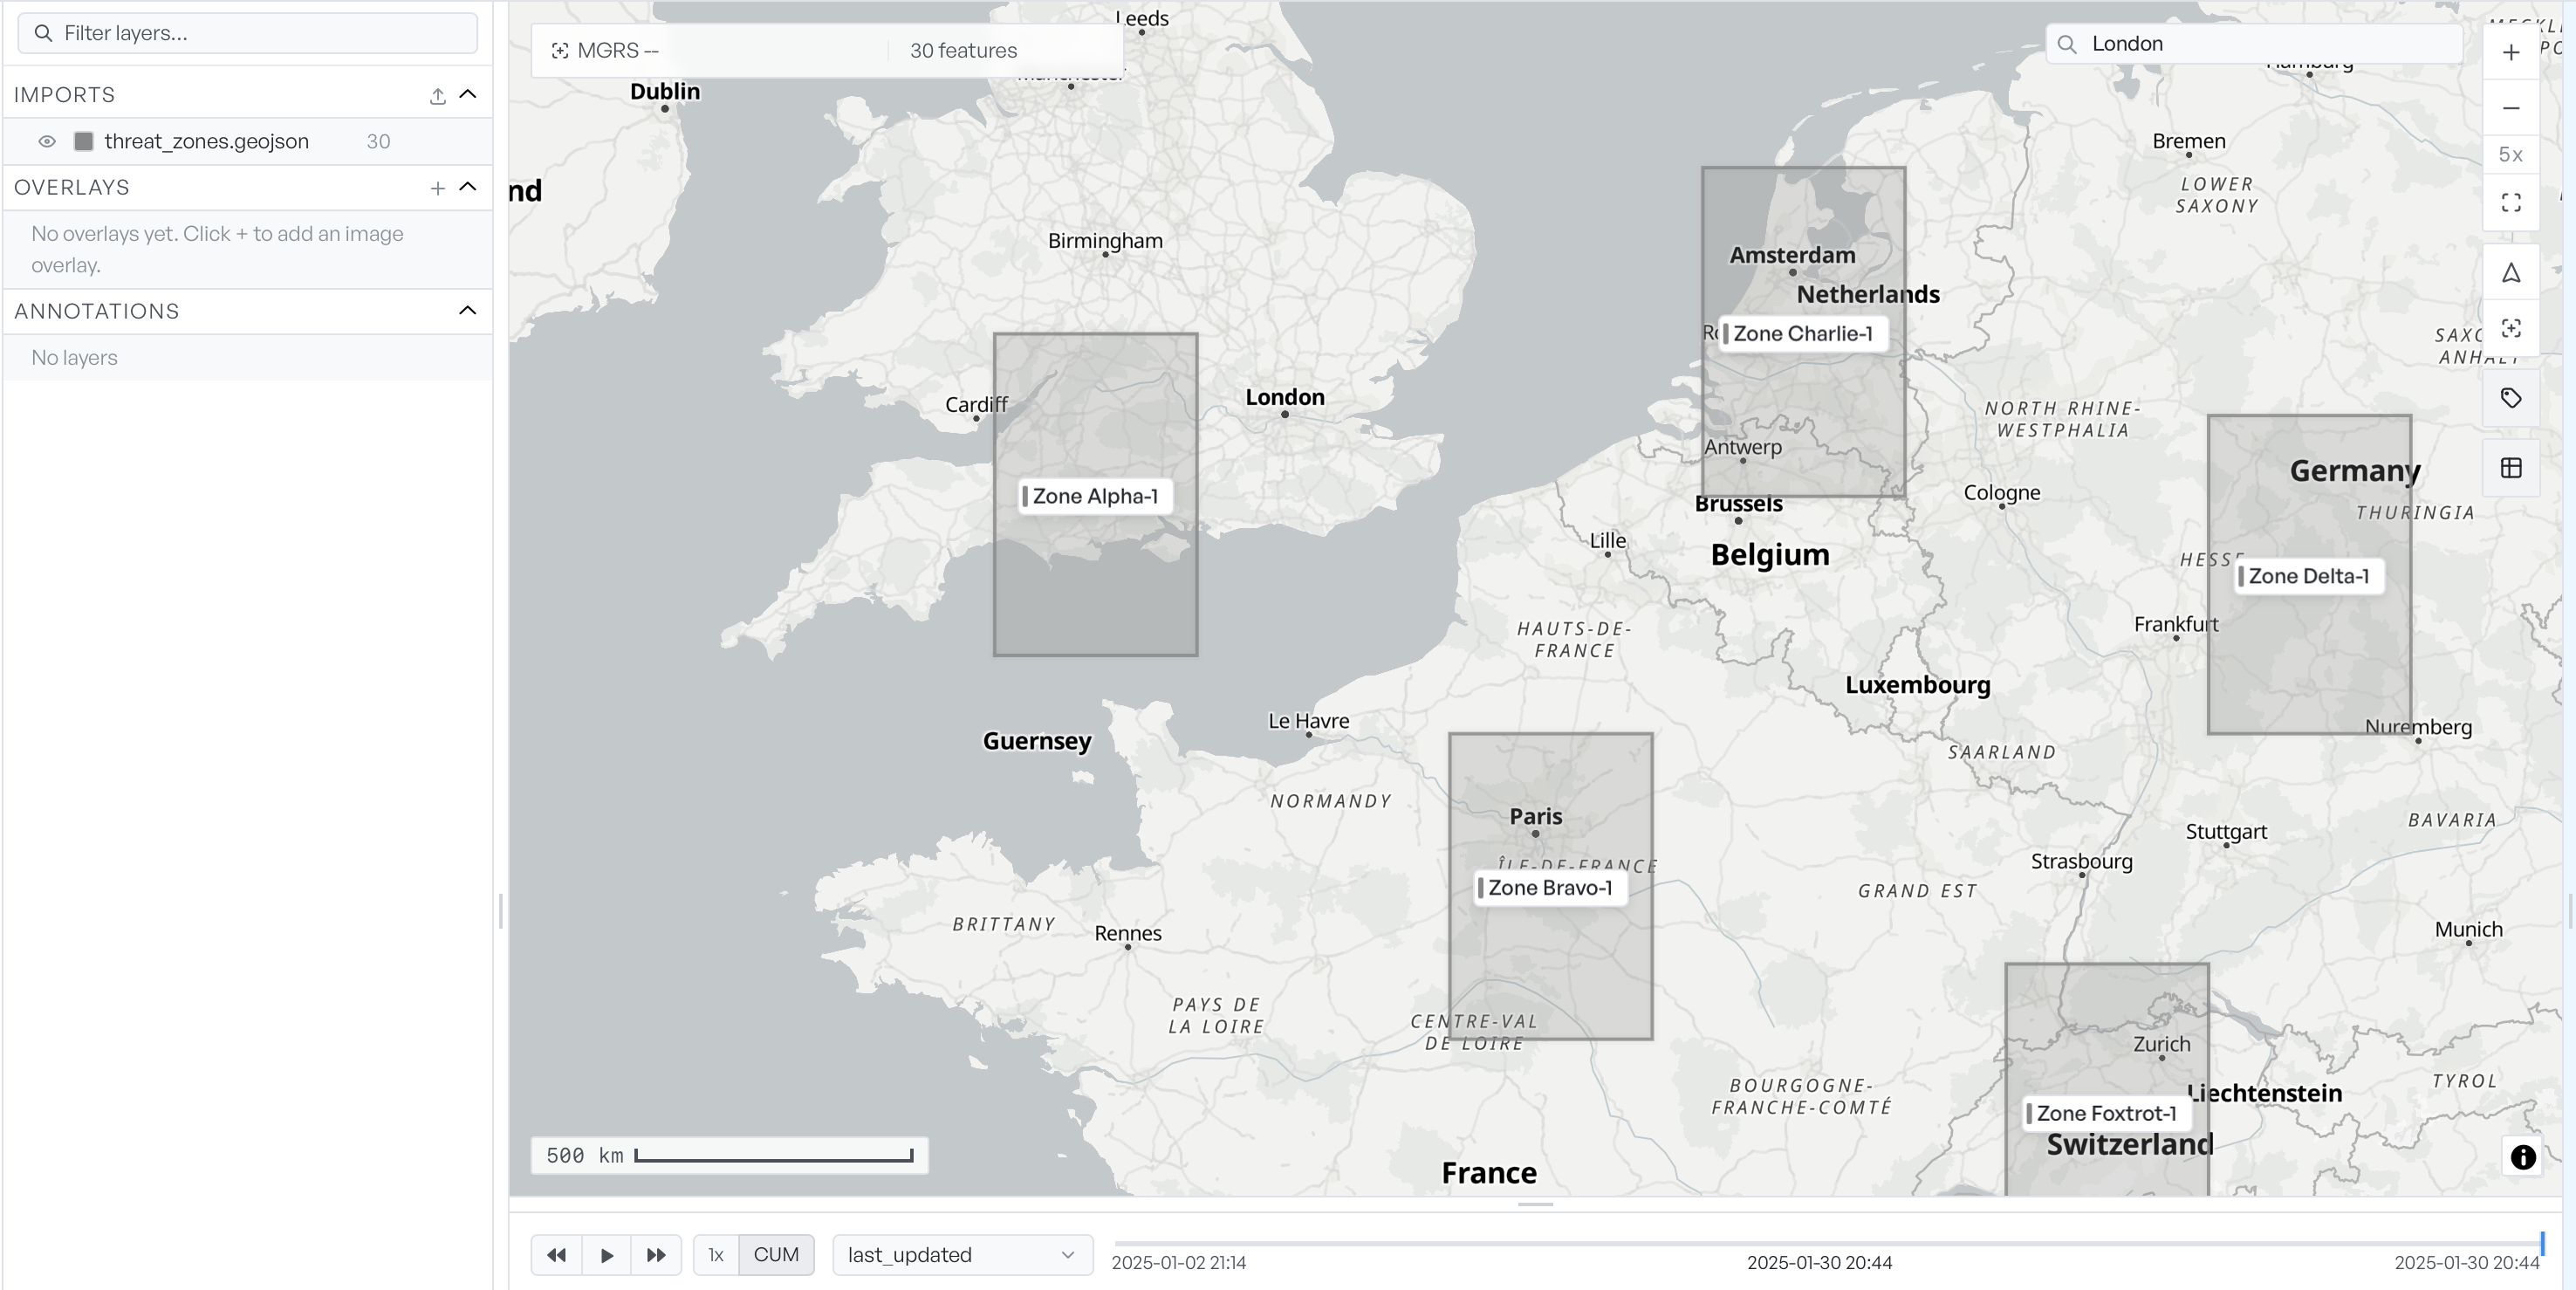
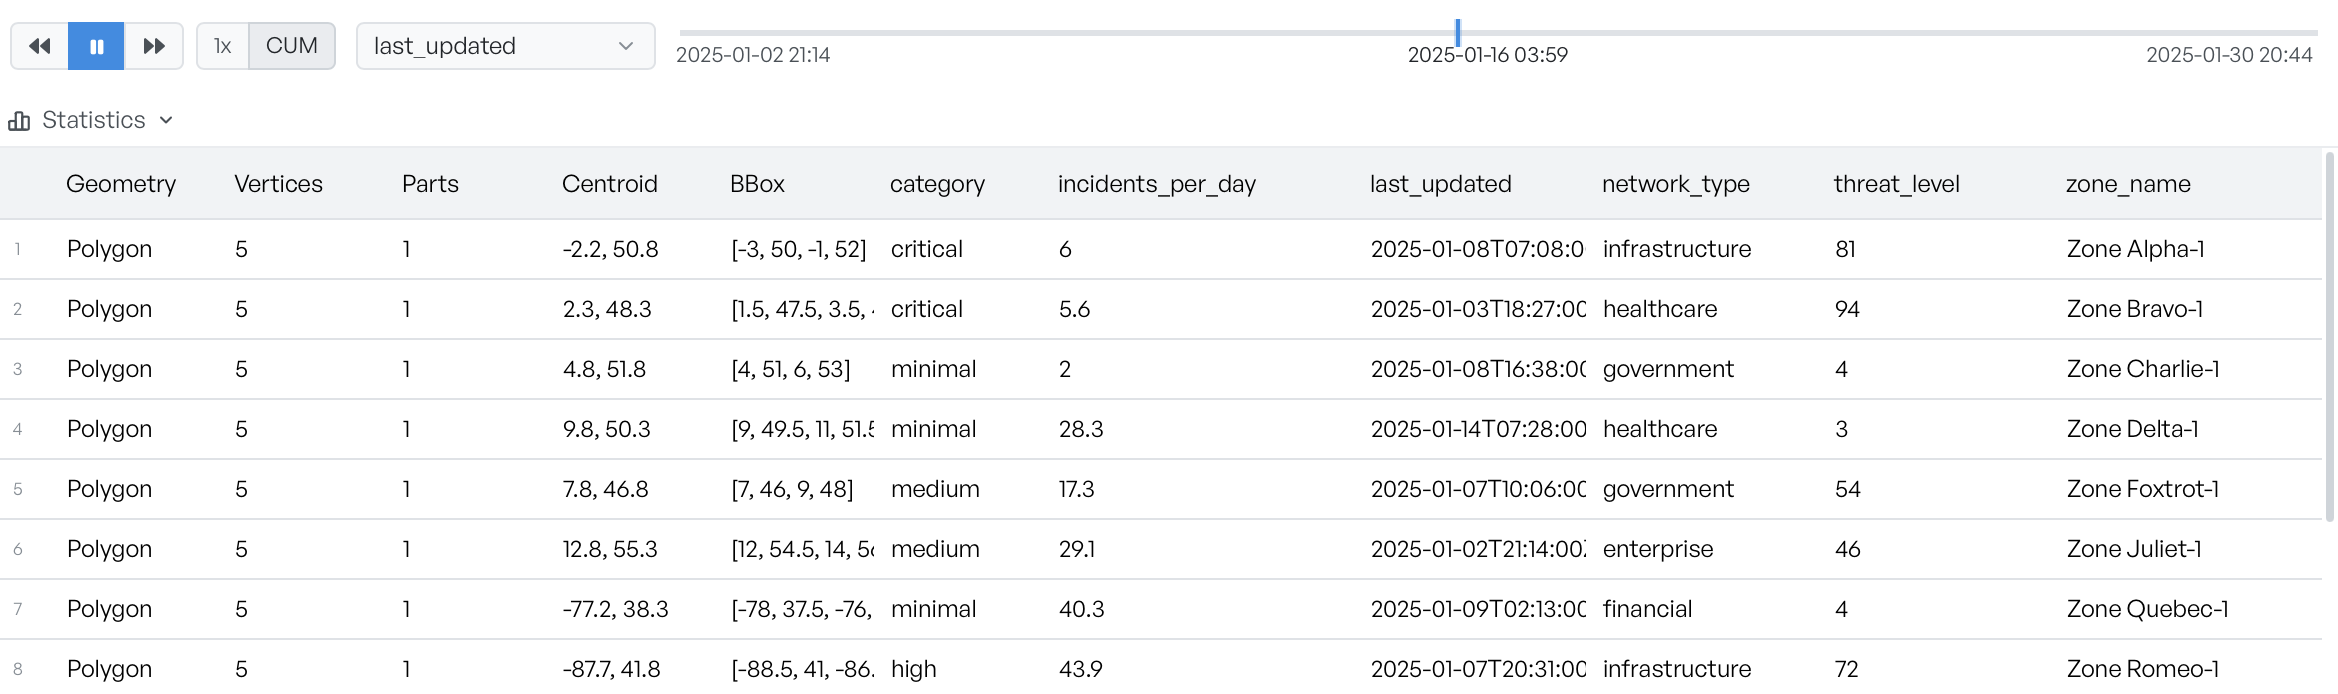
Import a file of features and Geo Map draws them on the map, lists every one in an attribute table underneath, and opens the properties of whatever you select in a side inspector. Here a GeoJSON of threat zones plots as labelled polygons across the UK and western Europe, with the file listed in the layer sidebar and a playback timeline along the bottom.
- Attribute table lists every feature and flies to the one you click
- Context-sensitive inspector reads a feature, measurement or annotation
- A statistics panel summarises the active layer's columns
Everything on the map is a layer
Imported files, pinned images and shapes you draw yourself all become layers, sorted into Imports, Overlays and Annotations down the left. Each row hides or shows its layer, sets a colour and opens styling controls, and the active layer is what the attribute table, statistics and export all work on.
- GeoJSON, CSV, shapefiles, KML, GPX and more, one file per layer
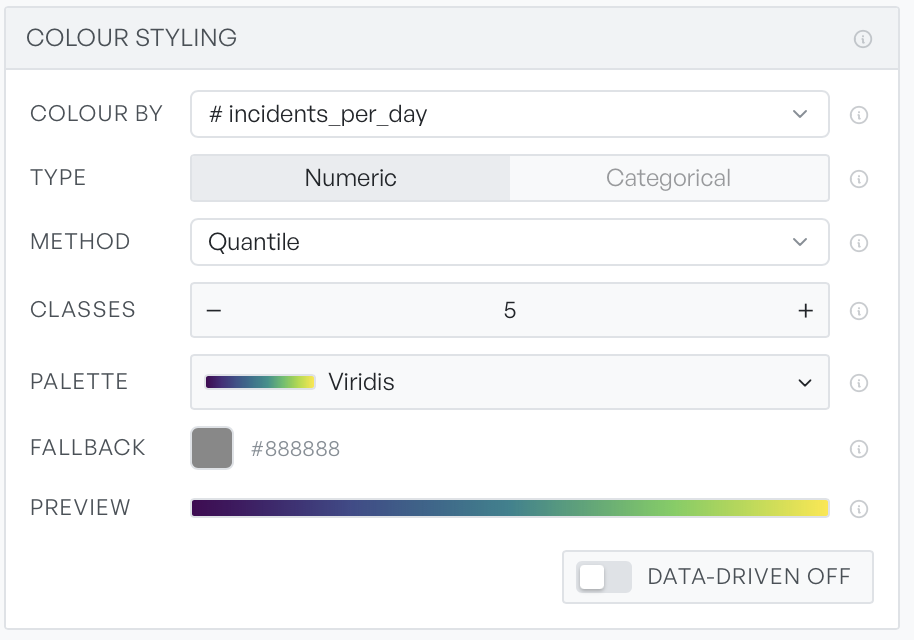
- Colour a layer by a property value, not just a single fixed colour
- Render modes for clusters, hexagons, heatmaps, extrusions and flow
Every command a keystroke away
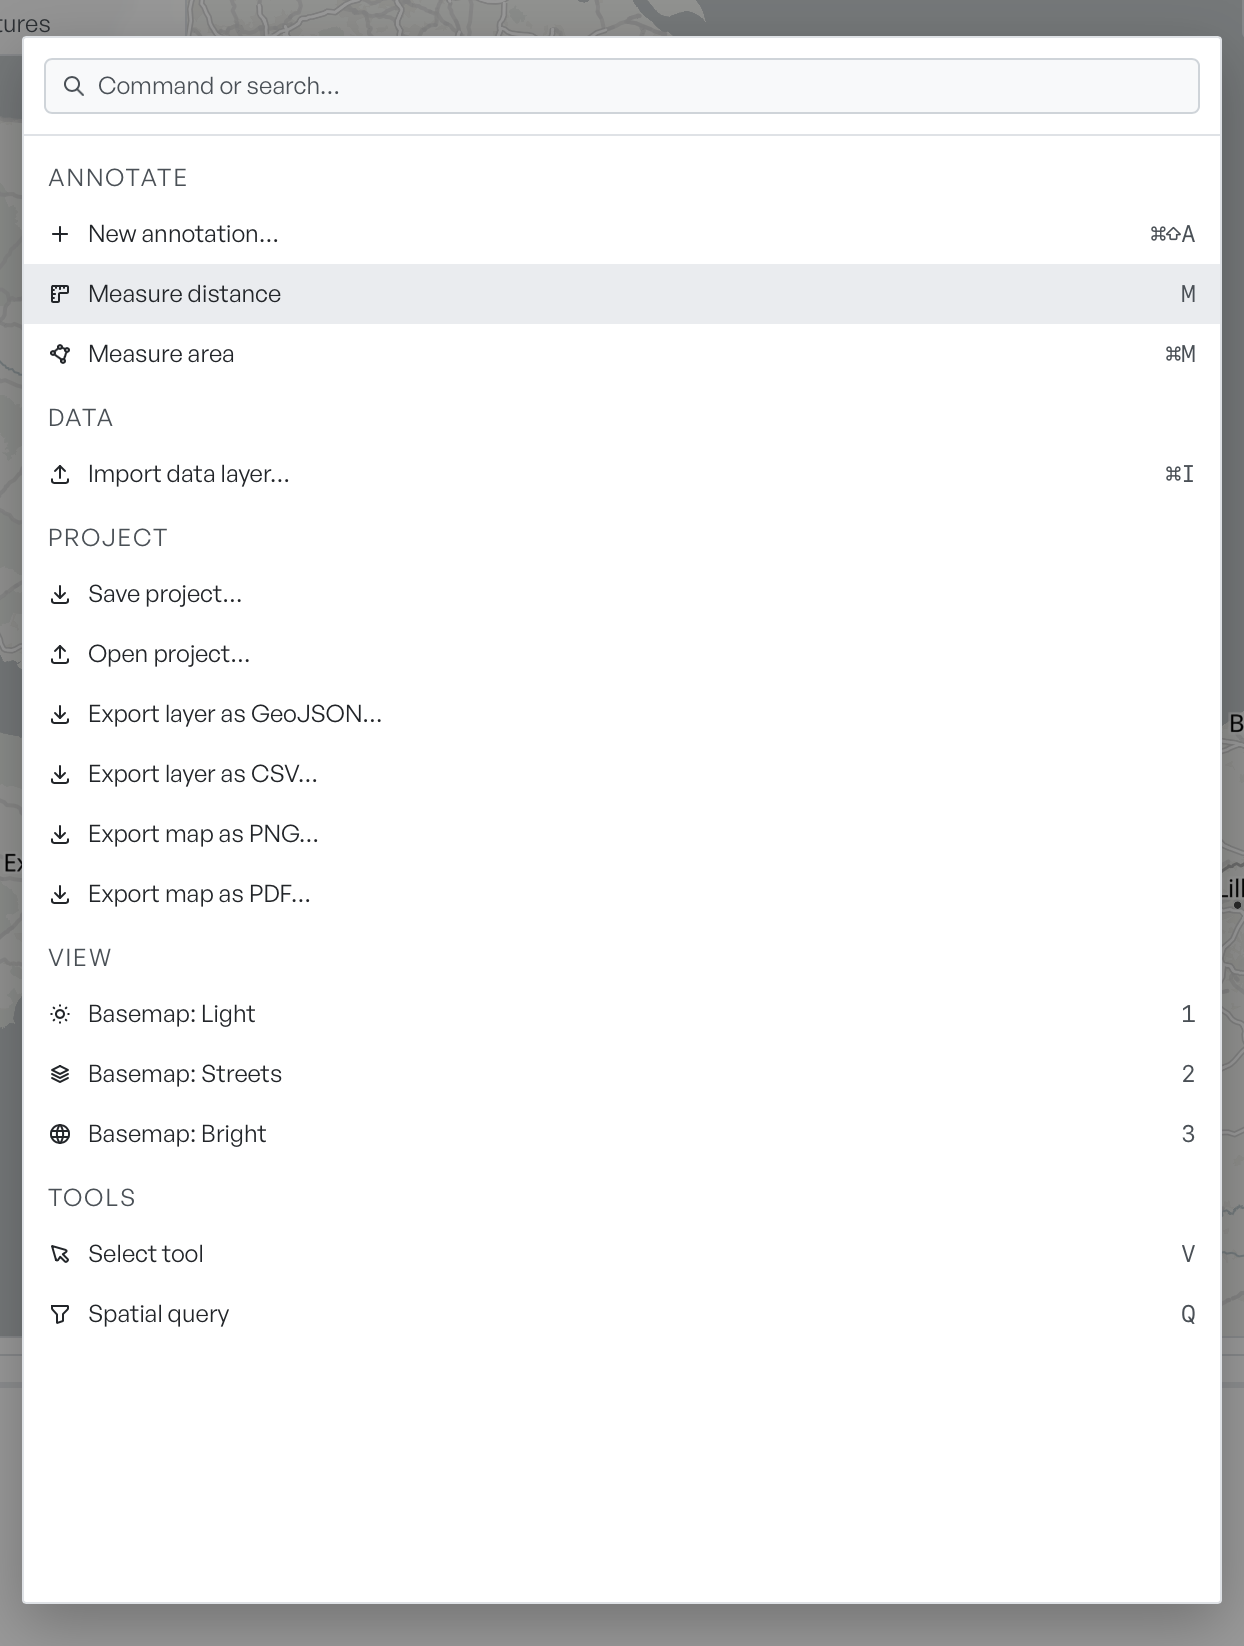
A command palette puts the whole toolset behind one shortcut. Import a data layer, switch the basemap between Light, Streets and Bright, run a spatial query, or export a layer as GeoJSON or CSV and the whole map as PNG or PDF, all without hunting through menus.
- Import layers and export as GeoJSON, CSV, PNG or PDF
- Switch basemaps and run spatial queries by shortcut
- Measure distance or area and drop annotations
Label features the way you want
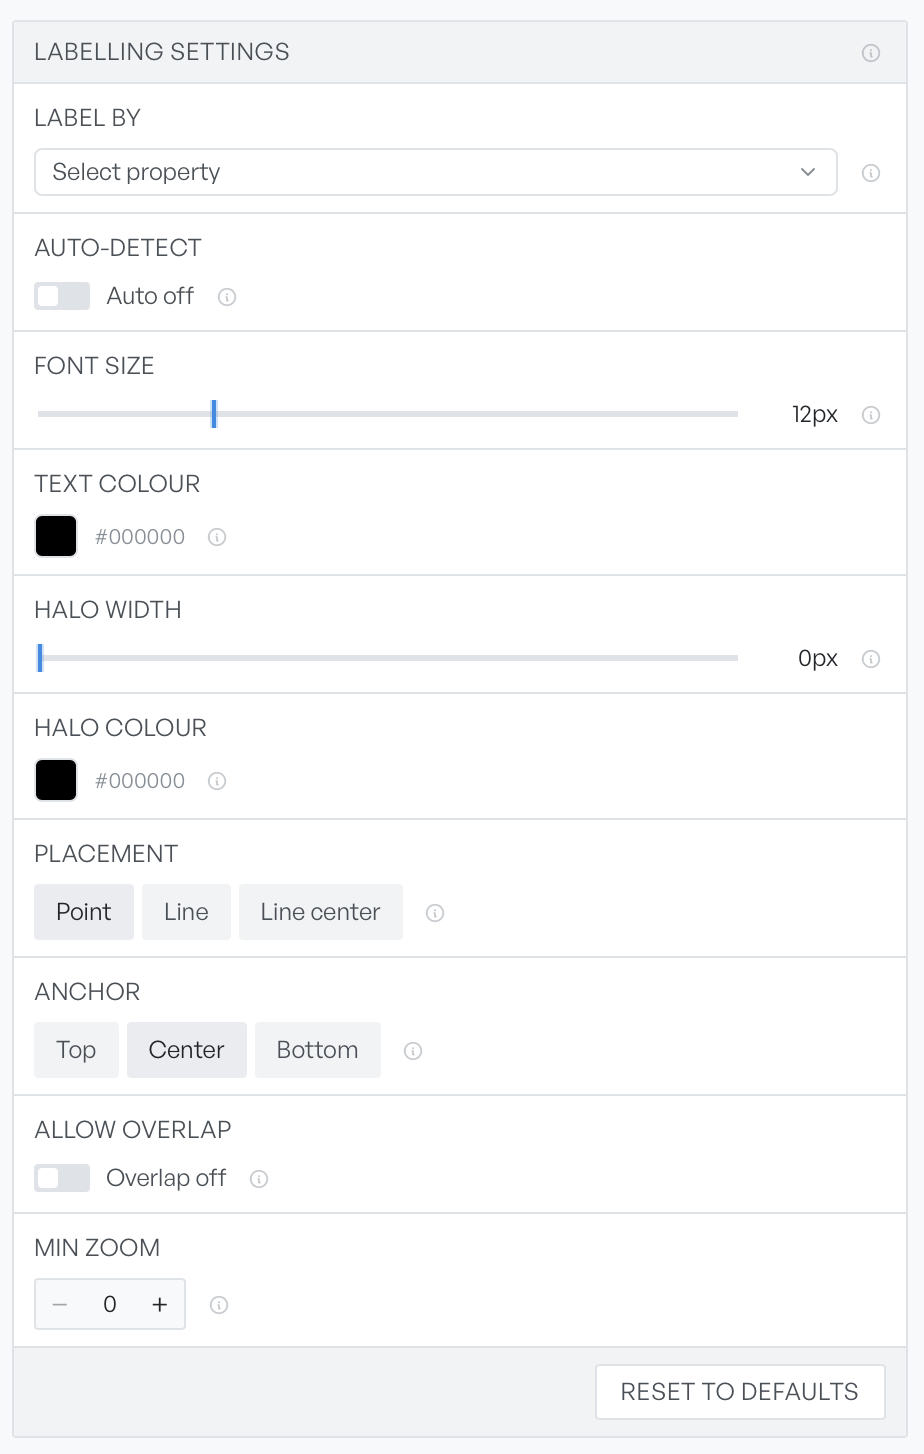
Turn any property into a label and control exactly how it reads. Pick the field, set the font size and colour, add a halo so text stands out over busy areas, and choose where each label sits relative to its feature.
- Label by any property, with optional auto-detect
- Font size, colour and a halo for contrast
- Placement and anchor control, with an overlap toggle
Measure distance and area
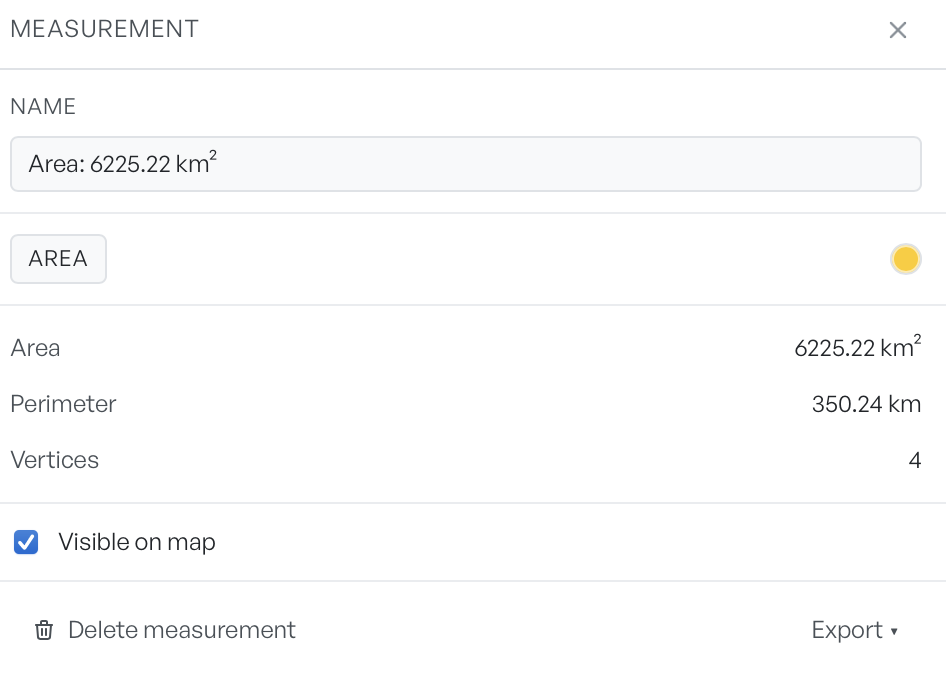
Draw a line or a shape on the map and Geo Map reports its size as you go. A measurement records its area, perimeter and vertex count, stays on the map as its own item, and exports alongside the rest of your data.
- Distance, area, perimeter and vertex count
- Each measurement is a saved item you can hide or delete
- Export measurements with the rest of the project
Scrub through time
When an imported layer carries timestamps, the timeline at the bottom of the map wakes up. Play it or drag the playhead to watch features appear, and switch between a cumulative view that builds up the whole picture and a window that shows only what falls inside a moving span. The timeline filters the attribute table, the statistics and any export as well as the map.
- Cumulative and window modes, with a selectable span
- Pick which date column drives the timeline
- Playback speed steps from half to five times