Read hosts and open ports#
The upper table gives one row per address with its open, closed and filtered counts, and selecting a host fills the port list underneath.
Results arrive in two layers: the hosts the scan found, and the ports of the host you select. Everything streams in while the scan runs, so you can read the results before it finishes.

The summary bar#
One line above the results gives the shape of the scan: how many hosts are up, how many down, how many open ports the scan found in total, and how many hosts have at least one open port.
Read that last figure first. Eleven hosts up with one host that has open ports describes a very different network from eleven hosts up with nine that expose services.
The host table#
Each row is one address. State says whether the host answered discovery, RTT is the round-trip time, and OS is filled only if you enabled detection.
The distinction between closed and filtered is the useful one. A closed port actively refused the connection, which means the host is reachable and nothing is listening there. A filtered port said nothing at all, which usually means a firewall absorbed the probe. A host with all ports filtered sits behind something. A host with all ports closed is exposed but idle.
To sort, click a column header. Each click cycles through descending, ascending, and unsorted. The filter box matches on address, hostname, and OS. Two checkboxes narrow the list further: Up only hides hosts that did not answer, and Has open ports hides the rest.
Right-click a row to open a menu with Trace route, which runs a traceroute to that host. The same menu copies cells, rows, or whole columns. This is how you get results out of the scanner, because there is no separate export button.
The port table#
Select a host to fill the Ports tab underneath. The scanner selects the first host it finds to be up, so the pane is rarely empty.
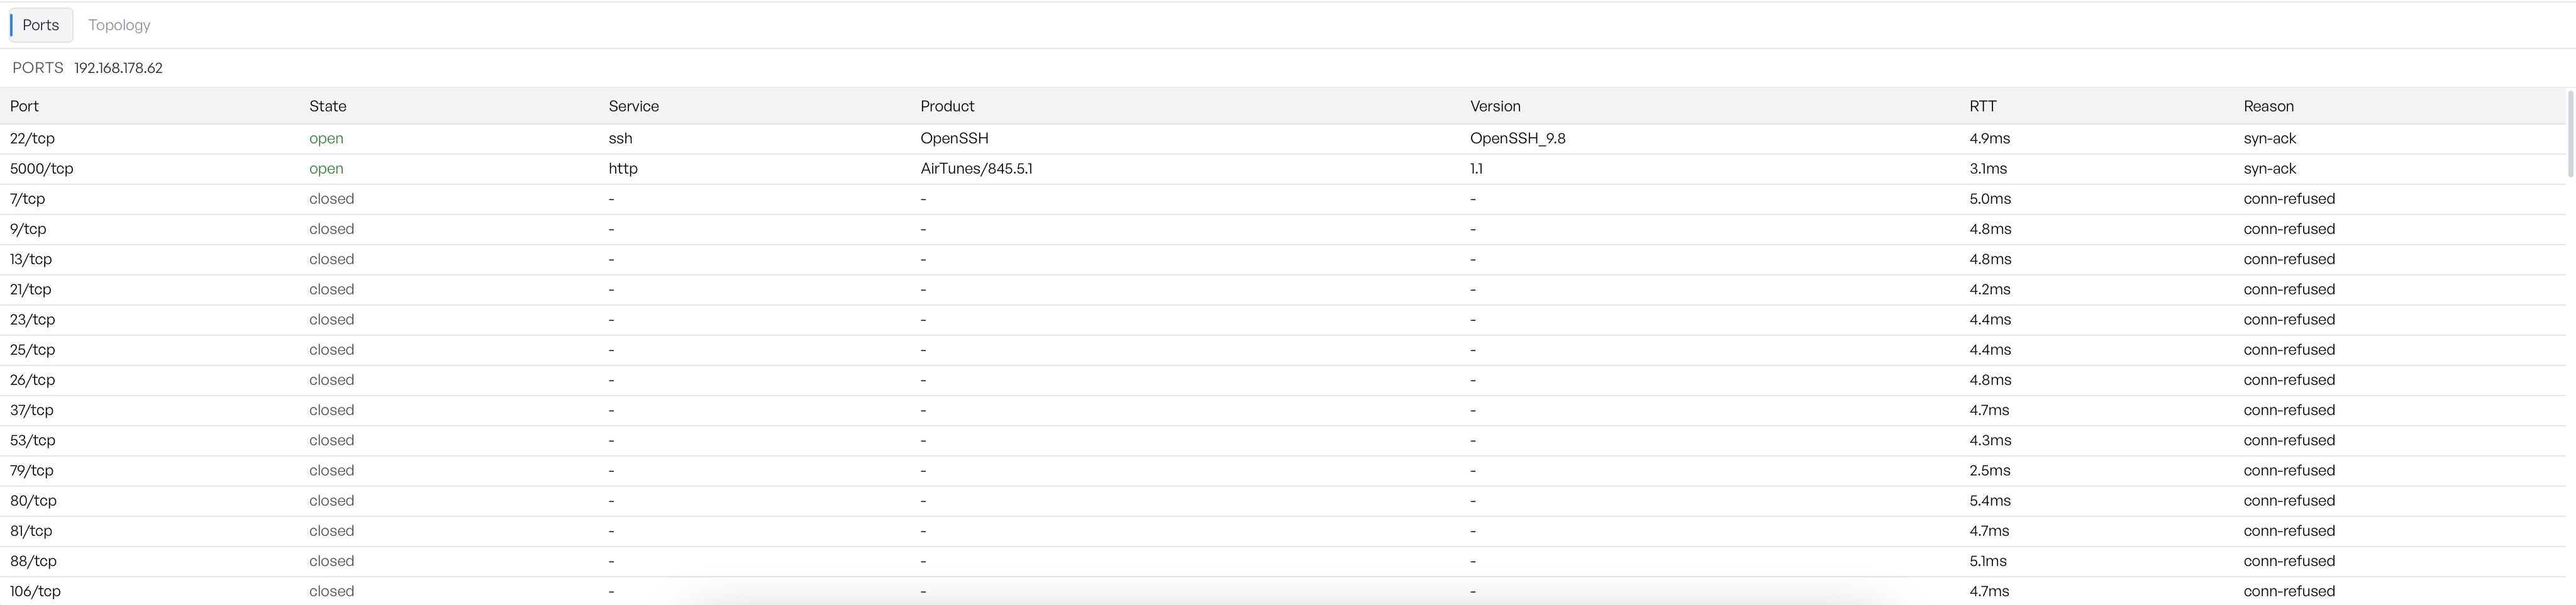
The table orders ports by how interesting they are rather than numerically: open first, then open|filtered, filtered, unfiltered, and closed last. Within each group the ports run in port order.
Service, Product, and Version come from service detection, and they are empty if you turned it off. Service is the guess based on the port number. Product and Version come from a probe of the port, so they are the more trustworthy of the two. Look again at a port that carries an unexpected product, such as a web server that answers on a port normally used for something else.
Reason records why the scanner classified the port as it did, most often syn-ack for an open port or conn-refused for a closed one. It is the evidence behind the state column.
While a scan is still working on a host the tab reads Scanning ports.
The Services and Topology tabs#
The Services tab beside Ports groups the same data by service rather than by host. It is the better view when you want to know what a whole network exposes. See Services.
The Topology tab draws the hosts and the routes between them. See Topology.