Read the network map#
Colour and size mark how much each host exposes, and solid edges mark routes you measured against dashed edges that are only assumed.
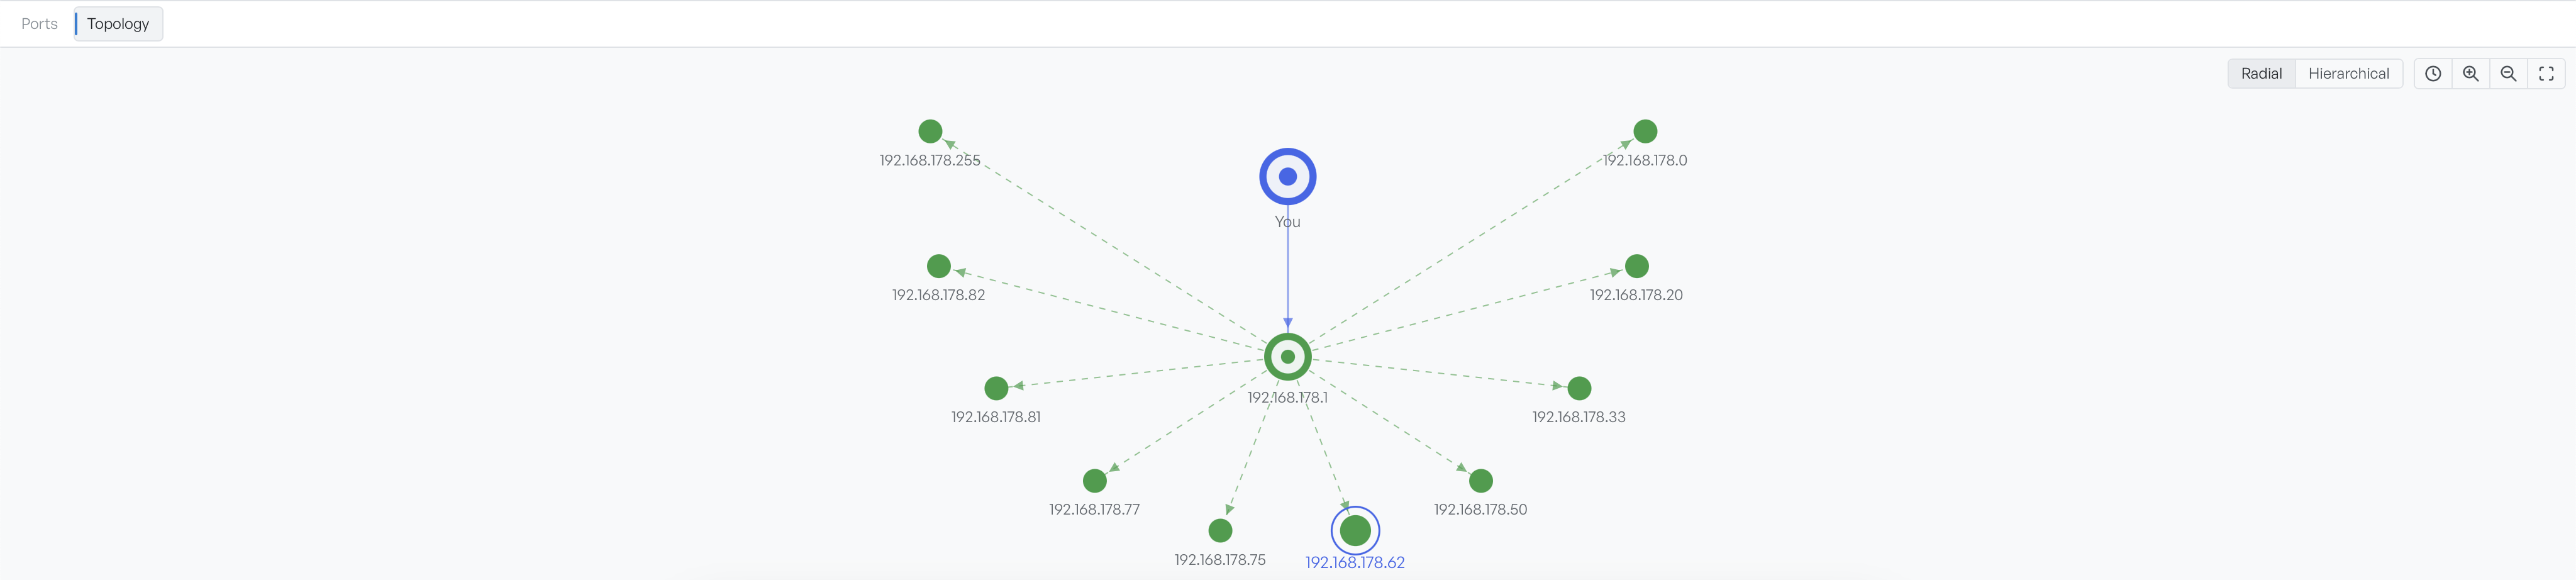
The Topology tab draws the scan as a map rather than a table. The map shows your machine, the gateway it reaches the network through, and every host that answered. Size and colour show how much each host exposes.
The map comes from the hosts the scan found and from any traceroute you have run, so it is useful straight after a scan. With no traceroute data, every host sits one step from the gateway in a simple fan.
Colour, size and shape#
Three properties of a node carry the scan result:
- Colour: encodes exposure. Green marks a host with fewer than three open ports, amber three to six, and red seven or more. Grey marks a router on a traced path that was never scanned, and blue is your own machine.
- Size: carries the same information more finely. A node grows with its open-port count and levels off at twelve.
- Shape: separates roles. Your machine and the gateway are drawn as a ring with a dot at the centre. Ordinary hosts are solid discs. A hollow circle with a dashed outline is a hop on a traced route that was not itself scanned, and a hop that never replied is labelled
* * *.
Colour is the fastest thing to read, and a large red node is the machine to look at first.
Only the hosts the scan found to be up appear. The map infers the gateway, usually from the first hop of a traceroute, or else from the host at .1 on the network.
Solid and dashed edges#
A solid line is a real route, either a traceroute hop or the link from your machine to the gateway. A dashed line is inferred: either an alternate route into a host already reached another way, or a presumed link to a host that is up but was never traced.
Solid lines are measured, dashed lines are assumed. Run a traceroute against a host, from the right-click menu in the host table, to turn an assumption into a measurement.
Switch layout, zoom and pan#
The controls at the top right set the layout and the view:
- Radial: arranges hosts in rings around your machine. This is the default.
- Hierarchical: arranges hosts in rows by distance, which reads better on a long traced path.
- Clock button: adds each host's latency to its label.
- Zoom buttons: zoom in, zoom out, and fit the whole map to the view.
Scroll to zoom and drag to pan. Point at a node to dim everything that is not directly connected to it, which is how you isolate one machine's links in a crowded map. Select a node to select that host in the table above, so the map and the results stay in step.
The map holds its positions while a scan runs. Nodes change colour and size in place rather than rearrange, so you can watch exposure build up without the layout moving underneath you.
Before you run a scan, the tab reads Run a scan to map the network, and the controls are hidden.