What the Performance tab measures#
The Performance sub-tab rolls the whole session into one read on speed, weight, caching, errors, and third-party cost, and every figure links back to the requests behind it.
The Performance tab takes the same requests you see in the entries list. It rolls them up into a single read on the session: how fast it was, how much it weighed, how much came from cache, what failed, and how much came from third parties. The tab answers questions about the whole capture that you cannot answer one request at a time.
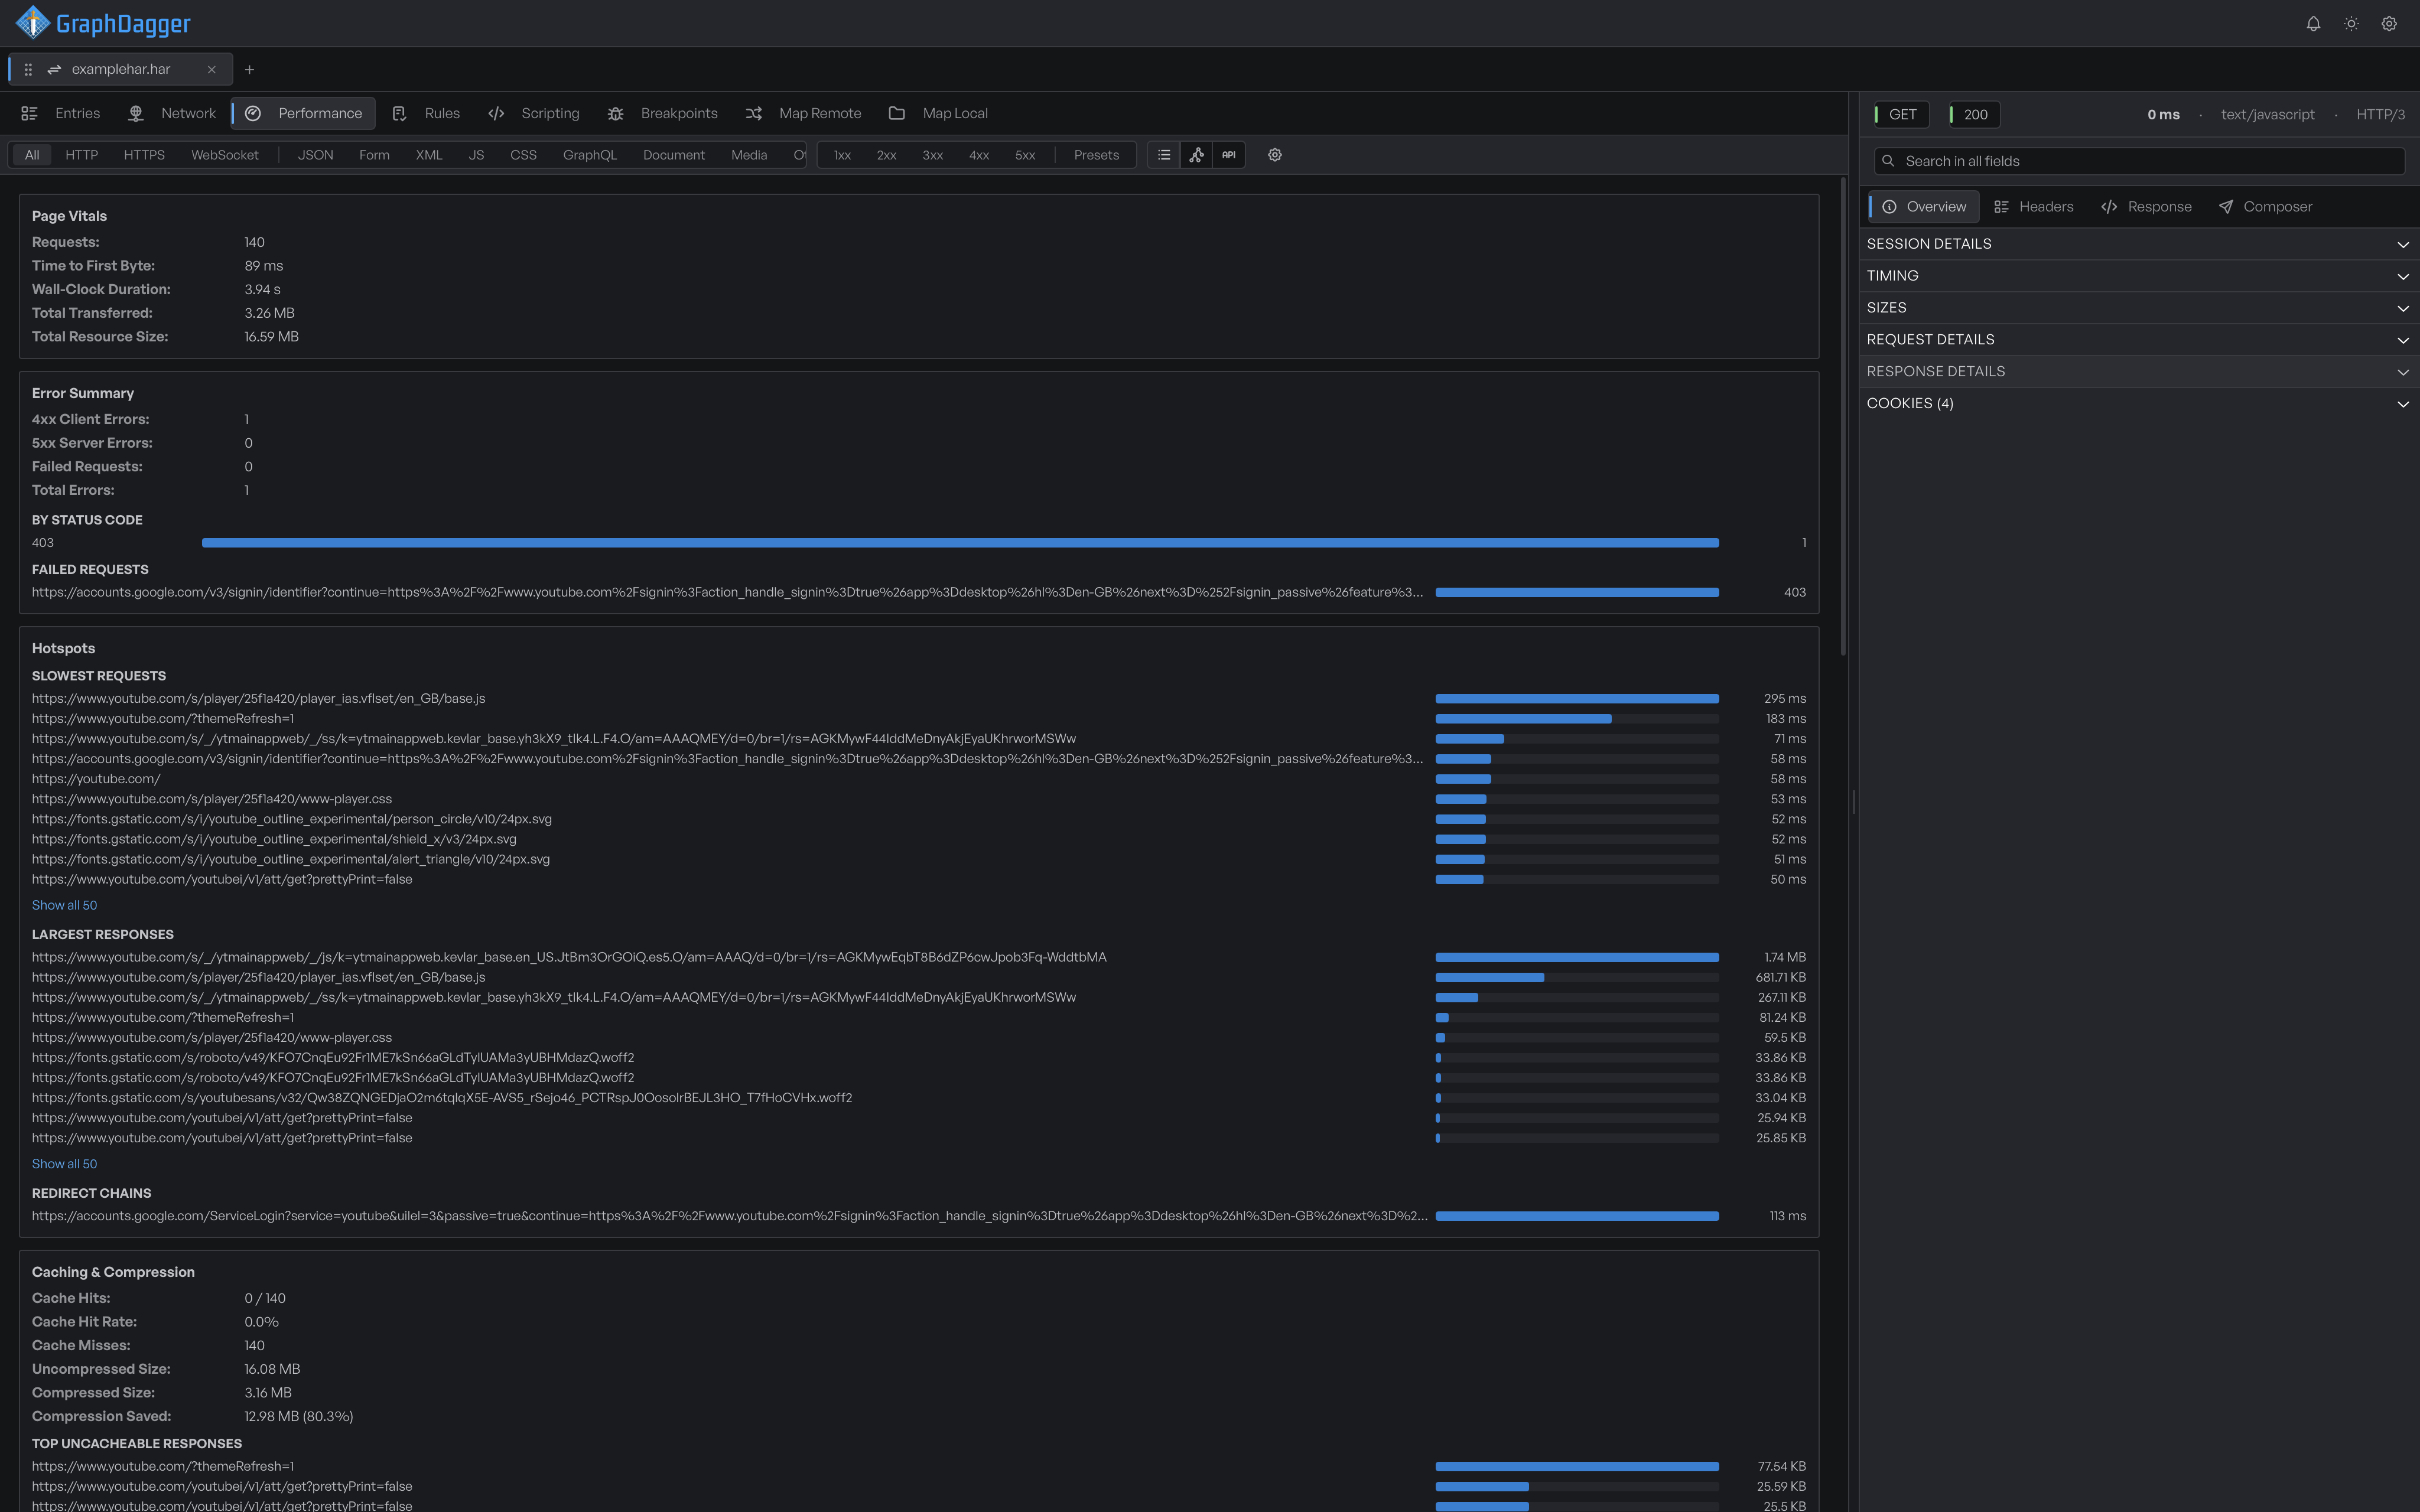
When the metrics appear#
The Performance tab works the same way for a live recording and for an opened HAR file. As soon as the session holds requests, the tab fills with metrics. During a live recording, the figures refresh about once a second as new traffic arrives.
Until a session holds traffic, the tab shows a short prompt instead of metrics. You do not configure anything first. The tab derives the numbers from the requests already in the session.
From a metric to the request#
The metrics are more than read-only totals. Where a figure points at specific requests, those requests are selectable: a failed request, a slow or oversized response, or a response that was not cacheable. Select one to open it in the inspector. You move from a number straight to the request behind it.
Compute metrics for large captures#
To work out these metrics, the tab reads every request in the session. For very large captures, the tab defers this work and stays responsive. Above 10,000 requests, the tab does not compute automatically. It shows the request count and a Compute now button. The figures appear only after you select the button. A Recompute button then refreshes them on demand.
Where to go next#
- Reading the metrics explains each section on the page.
- Per-site breakdown splits the same metrics by the sites a session talked to.