What Web Debugger intercepts#
Web Debugger intercepts HTTP, HTTPS, and WebSocket traffic, and this page shows how the two panes and the sub-tabs above them fit together.
Web Debugger intercepts HTTP, HTTPS, and WebSocket traffic between a client and its server. You can record live traffic from a browser, a terminal, a remote device, or any client that points at the proxy port. You can also open a HAR file from another tool. When a session holds traffic, every other view in the workspace works the same way.
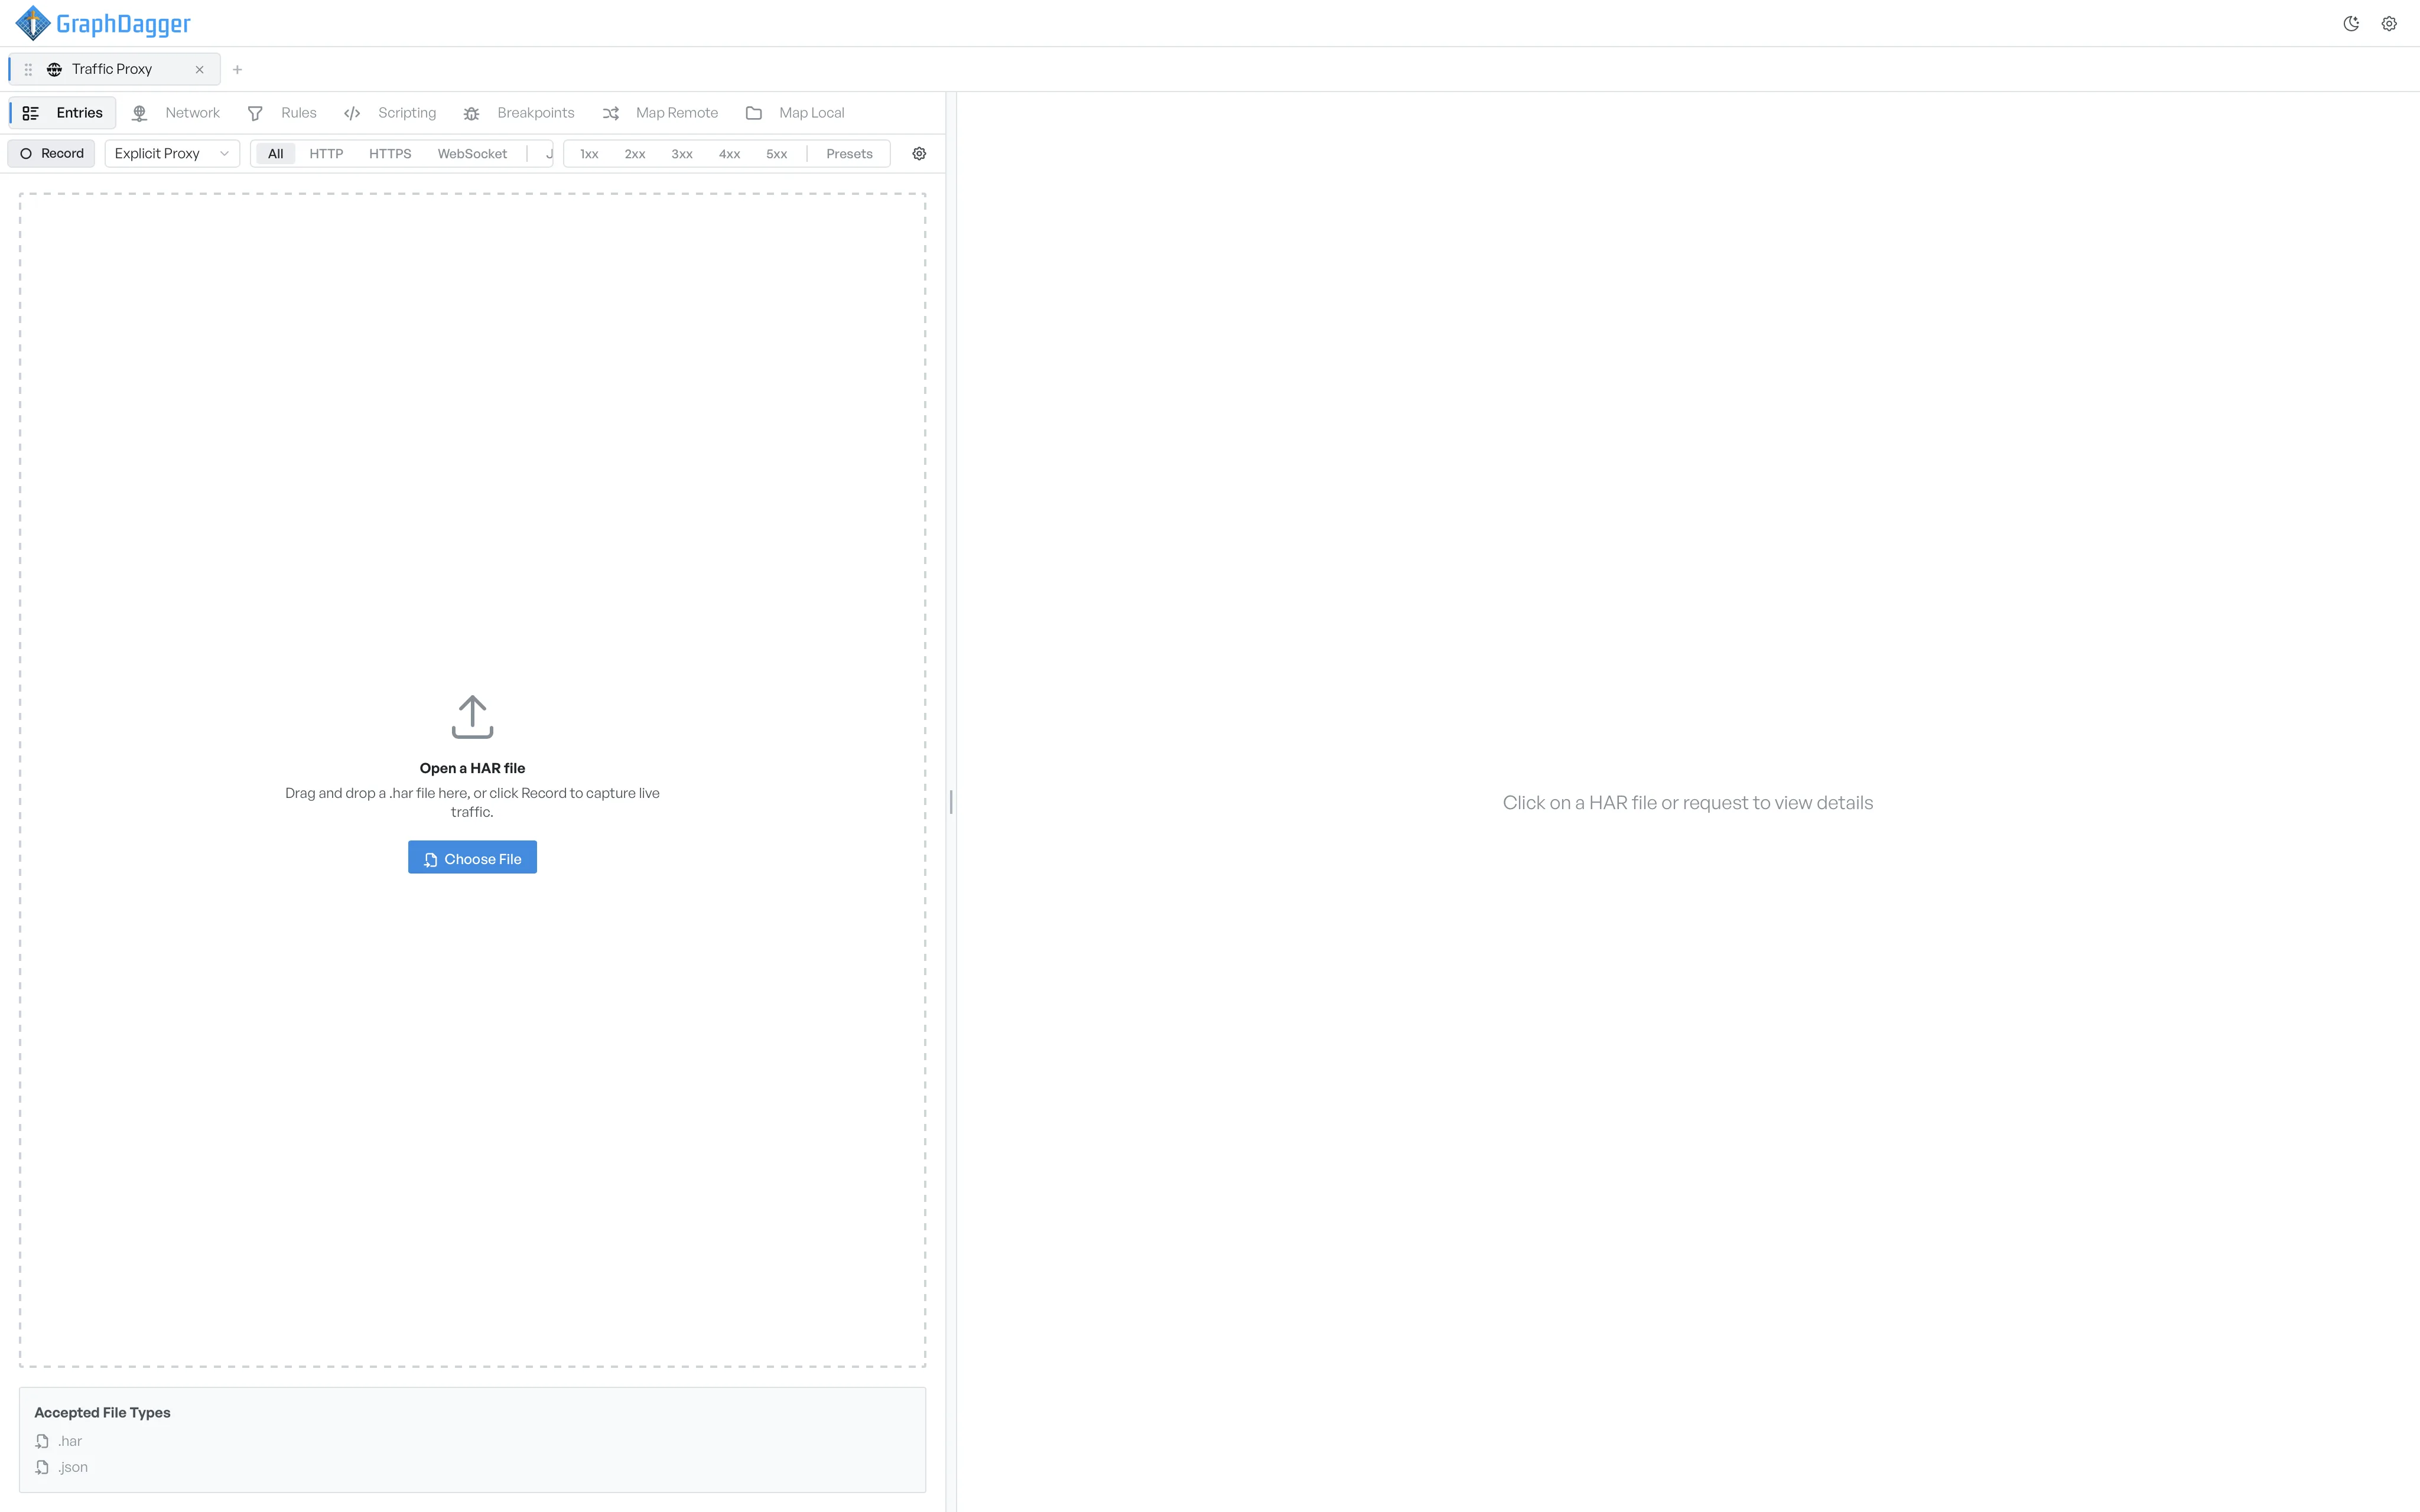
How the tab is split#
A Web Debugger tab has two panes side by side.
- The left pane holds the active sub-tab (entries, network graph, rules, and so on) with the recording toolbar above it.
- The right pane holds the request inspector. It updates whenever you select a row in the entries list.
You can drag the vertical divider between the two panes to give either side more room.
What each sub-tab does#
A row of sub-tabs runs across the top of the left pane:
- Entries: the request list and timeline.
- Network: a tree of which request kicked off which.
- Performance: metrics rolled up across the whole session.
- Rules: conditional, reusable transforms that apply automatically.
- Scripting: JavaScript that runs on matched requests or responses (live recording only).
- Breakpoints: conditions that pause a request or response so you can edit it before it continues.
- Map Remote: redirect a host or URL to another host.
- Map Local: serve URLs from a directory on your machine.
The Performance tab works for both a live recording and an opened HAR file.
Where to go next#
- Start a recording to capture live traffic.
- Open a HAR file to inspect a saved session.
- Read the inspecting requests guide when a session holds traffic.