What the entries view shows#
The entries list on the left holds a row per request and the inspector on the right opens the one you select.
After a session has traffic in it, you read individual requests in the Entries sub-tab. The right pane is the inspector, which opens when you select a request. This page covers the layout. Sub-pages cover each part in detail.
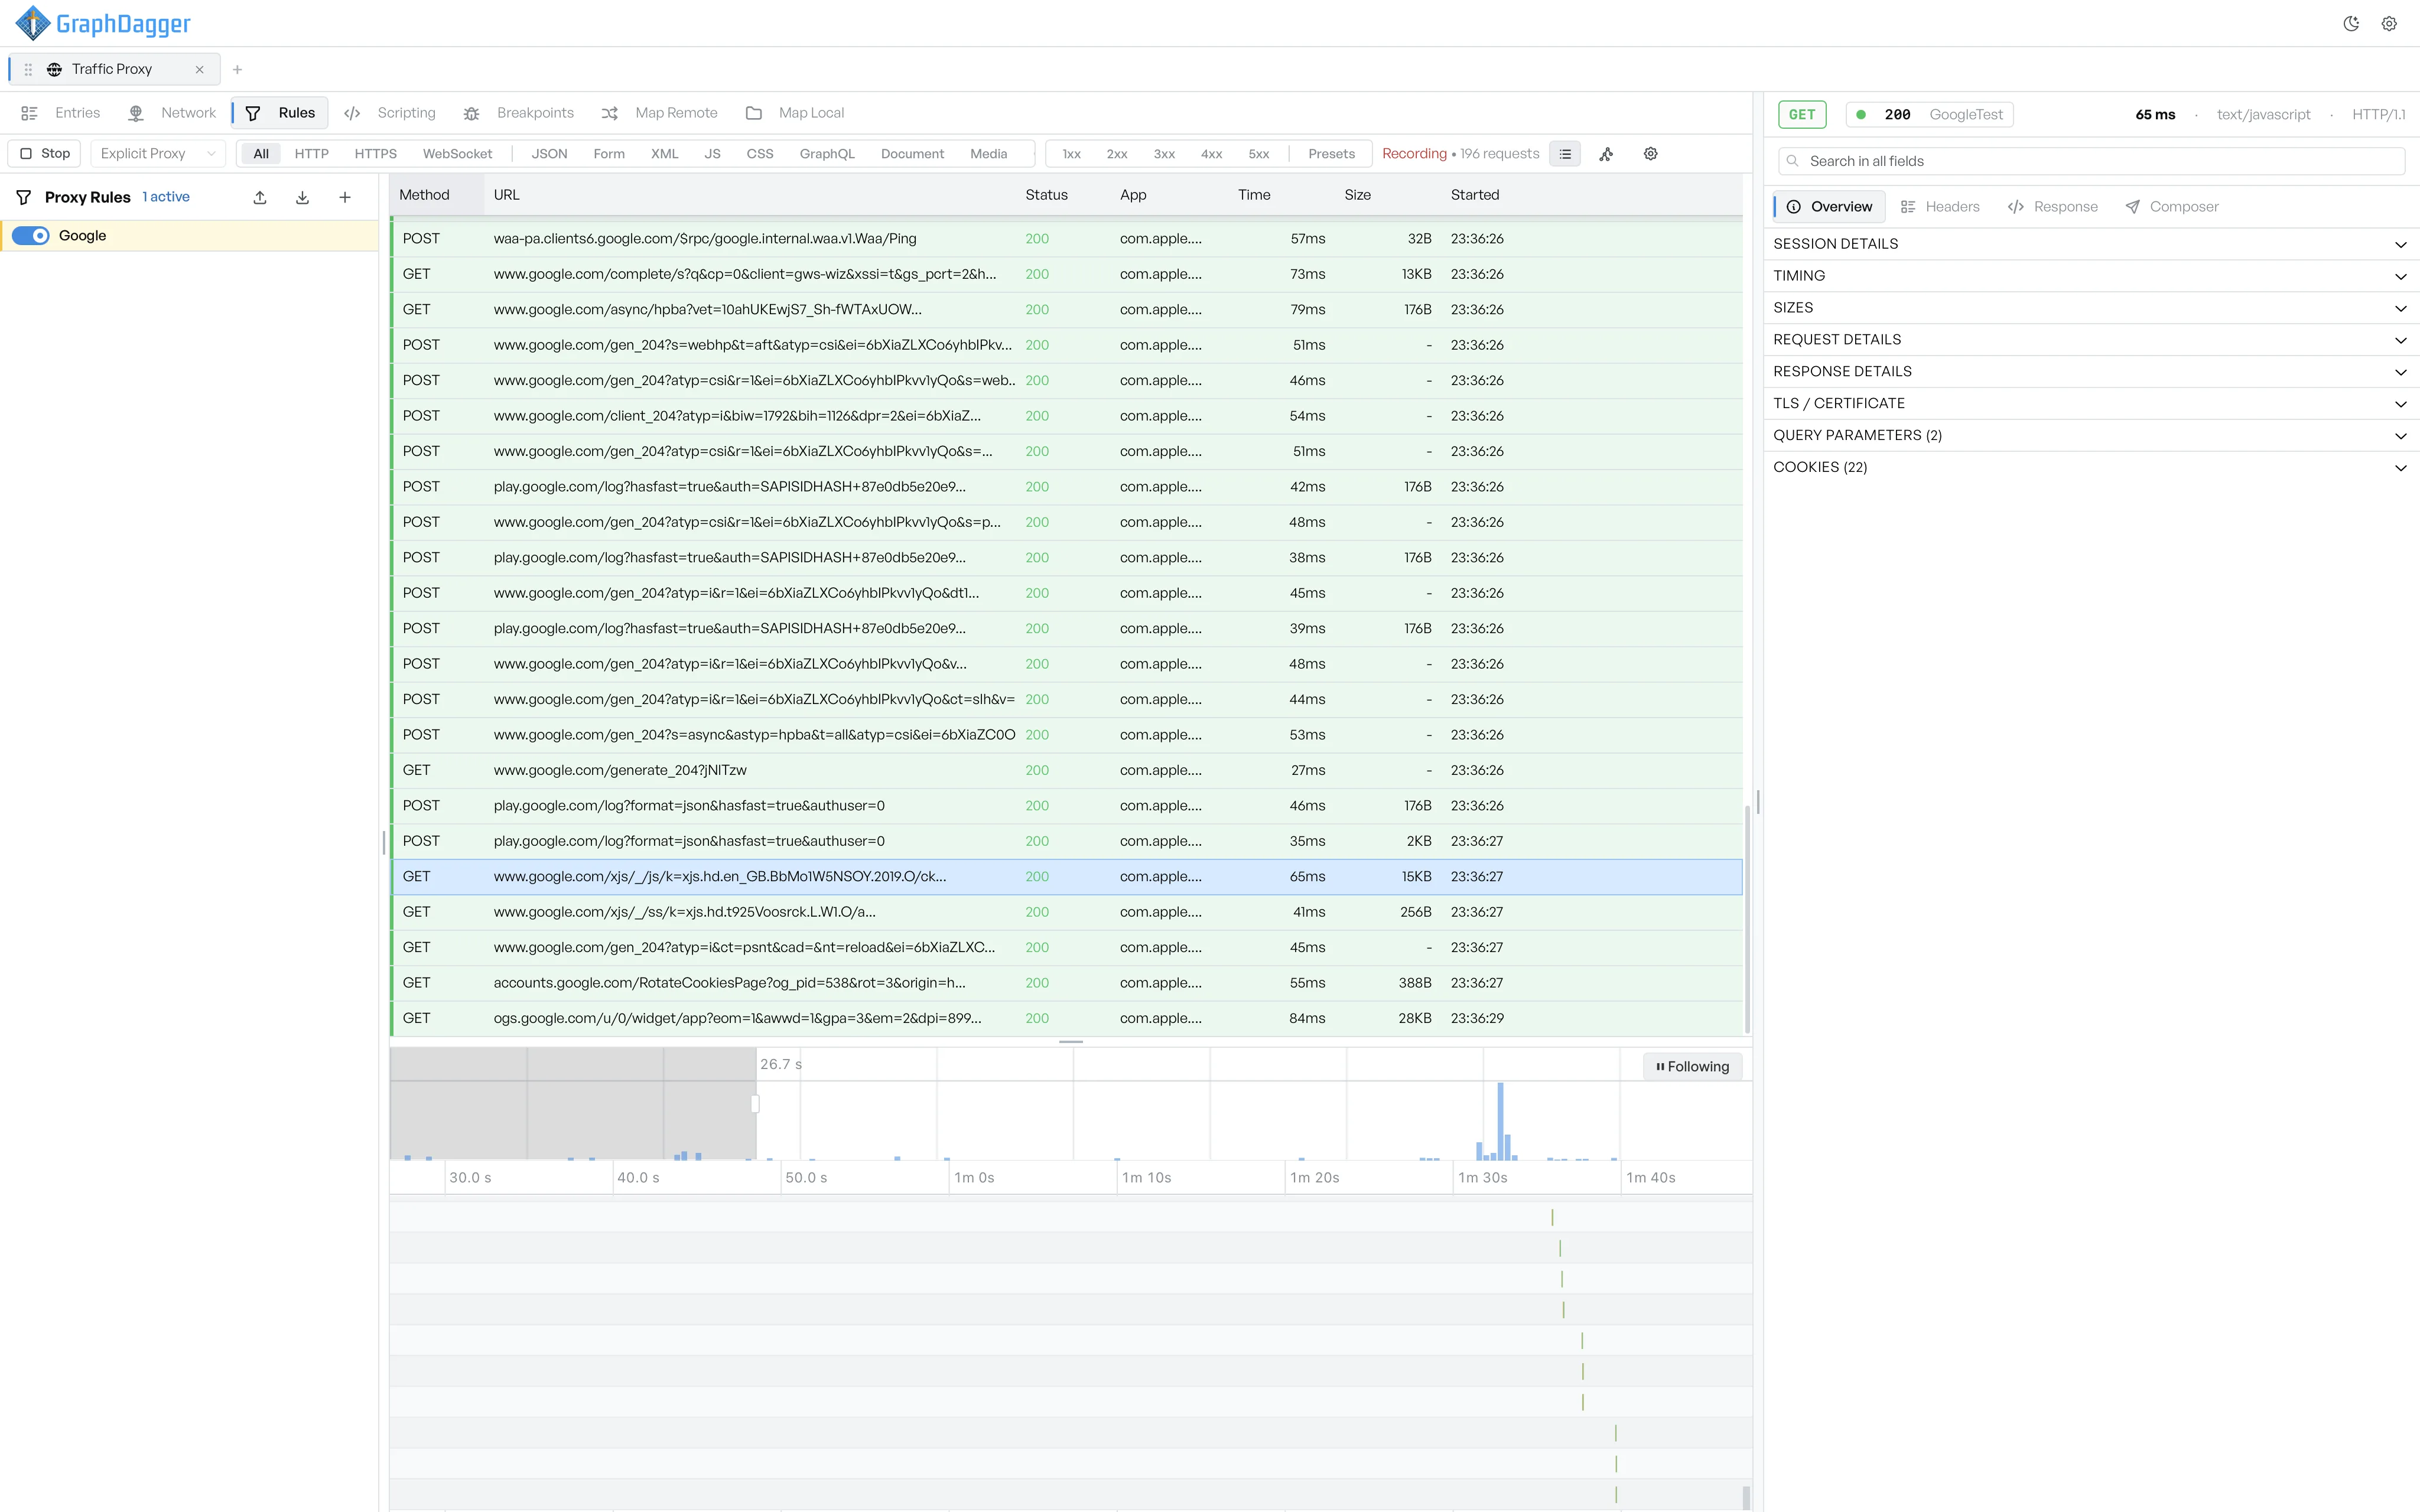
The entries list and the inspector#
- The left pane shows the entries list with a row per request, the recording toolbar above it, and a timeline histogram beneath it.
- The right pane is the inspector. It is empty until you select an entry. After you select one, it shows that request and response across several tabs.
A vertical divider sits between the panes. Drag it to give either side more room.
Filter and group the entries list#
- Filter the list by protocol, content type, or status class.
- Save and reuse filter presets.
- Group entries by host when you want to see what a session talks to.
- Generate an API spec as OpenAPI from the captured traffic.
- Compare two requests side by side to see what changed between them.
Read a request in the inspector#
The inspector has a row of tabs. The set depends on the request. For example, a request without a body has no Request tab.
- The full list of inspector tabs.
- The Overview tab for a full breakdown of session, timing, sizes, TLS, query params, and cookies.
- The Headers tab.
- The Request and Response tabs.
- The Form Data tab for form posts.
- The Auth tab for requests that carry detectable auth payloads.
- The Composer tab for replaying a request with edits.