Make an OpenAPI spec#
Work backwards from the captured traffic to an OpenAPI 3.0.3 description of every endpoint the session touched, then save it.
The API endpoints view reads the requests in a session and works backwards to the API behind them. It produces an OpenAPI 3.0.3 description that you can save and hand to other tools. You get one document instead of traffic one request at a time. The document lists every endpoint the session touched, the methods, and the parameters.
It is the third way to view the entries list, alongside the flat table and the structure view. It works the same way for a live recording and for an opened HAR file.
Switch to the API endpoints view#
The view-mode toggle sits towards the right of the toolbar after a session has traffic in it. It has three icons: a list icon for Table view, a tree icon for Structure view, and an API icon for API endpoints. Select the API icon to switch.
The spec updates when you change what goes into it.
How endpoints are grouped#
GraphDagger builds the list from the captured requests and groups them by host. The view folds requests that share a method and path into one endpoint. Ten calls to the same URL then become a single entry with a call count beside it, shown as a multiplier such as 2×. A heading at the top of the pane reports the total, for example 132 endpoints.
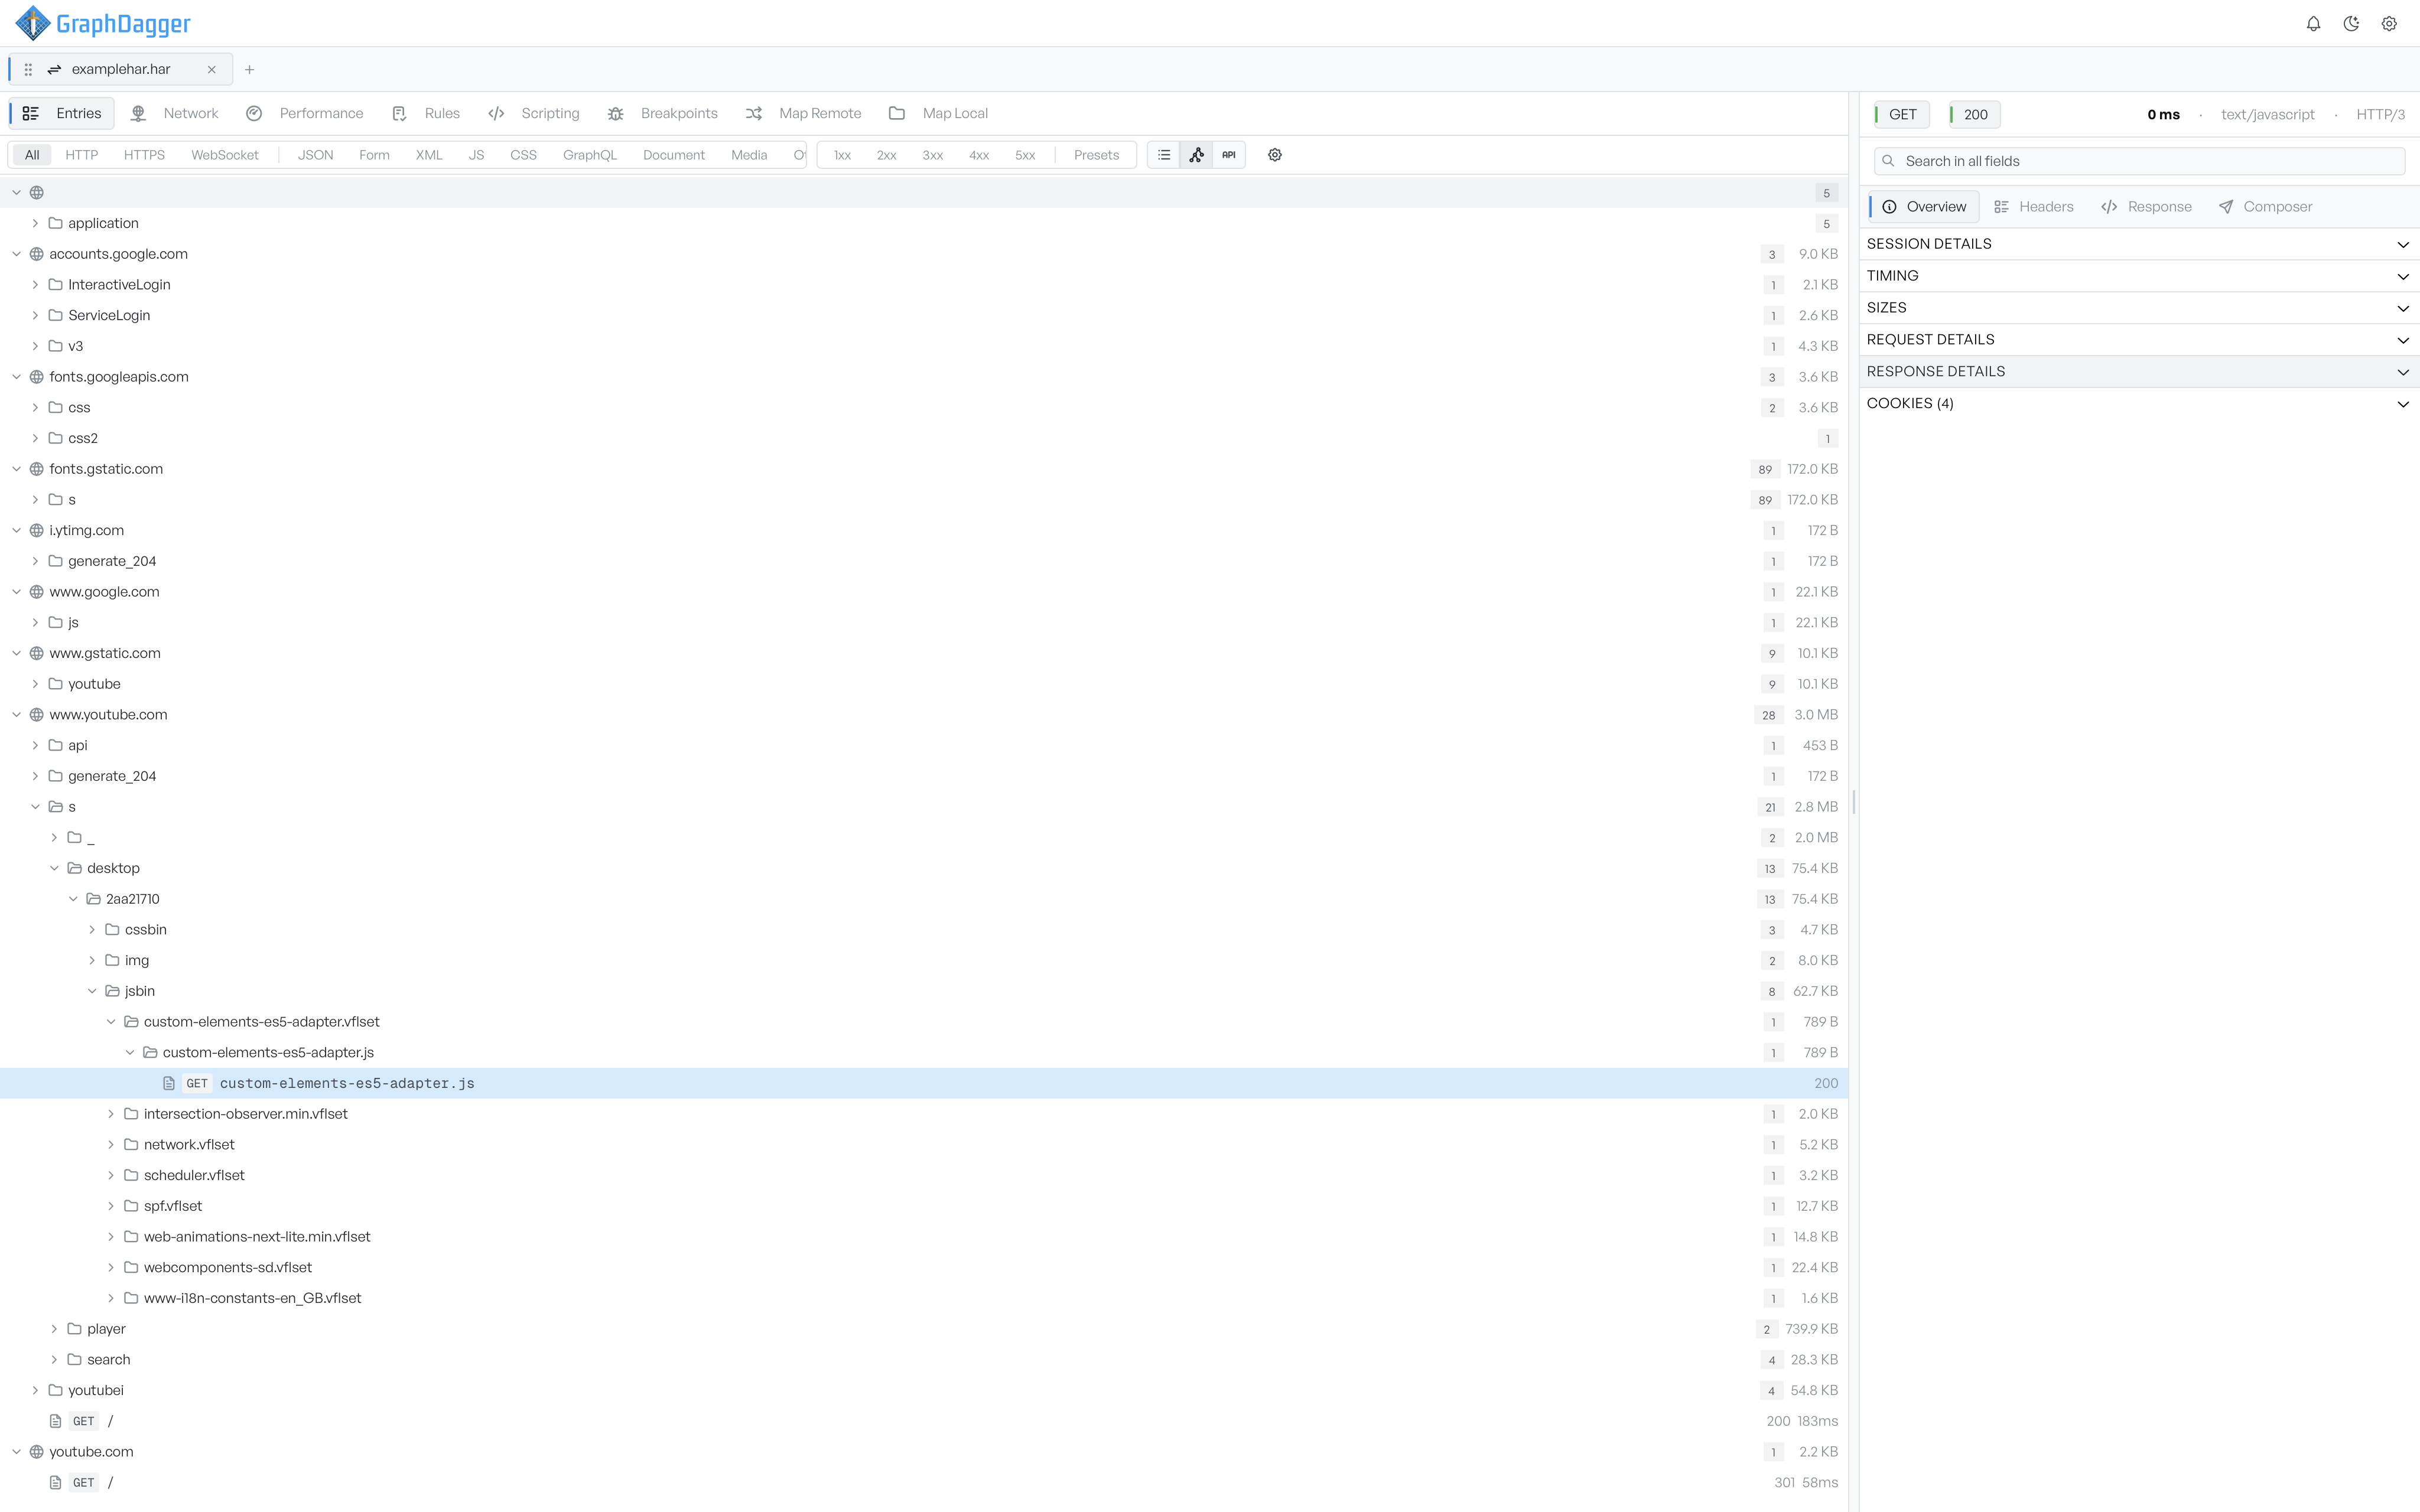
Two things shape how the endpoints come out. Detect path parameters, on by default, finds the variable parts of a path, such as an ID that changes from one call to the next. It collapses those parts into named parameters. Requests that would otherwise look like separate endpoints then line up as one. If you turn the option off, the view treats every distinct path as its own endpoint.
Not every request can become an endpoint. When the view leaves some out, a notice near the top of the list gives the number and the reason, for example 5 entries skipped (no usable request URL). If the session has no API-like traffic yet, the list shows a prompt in place of endpoints.
Control what the spec contains#
By default, the spec includes every discovered endpoint. Each row has a checkbox, and the list has a Select all button. Clear a row to leave that endpoint out, and use Select all to bring everything back. The method filter above the list, set to All methods by default, narrows both the list and the generated spec to one method at a time.
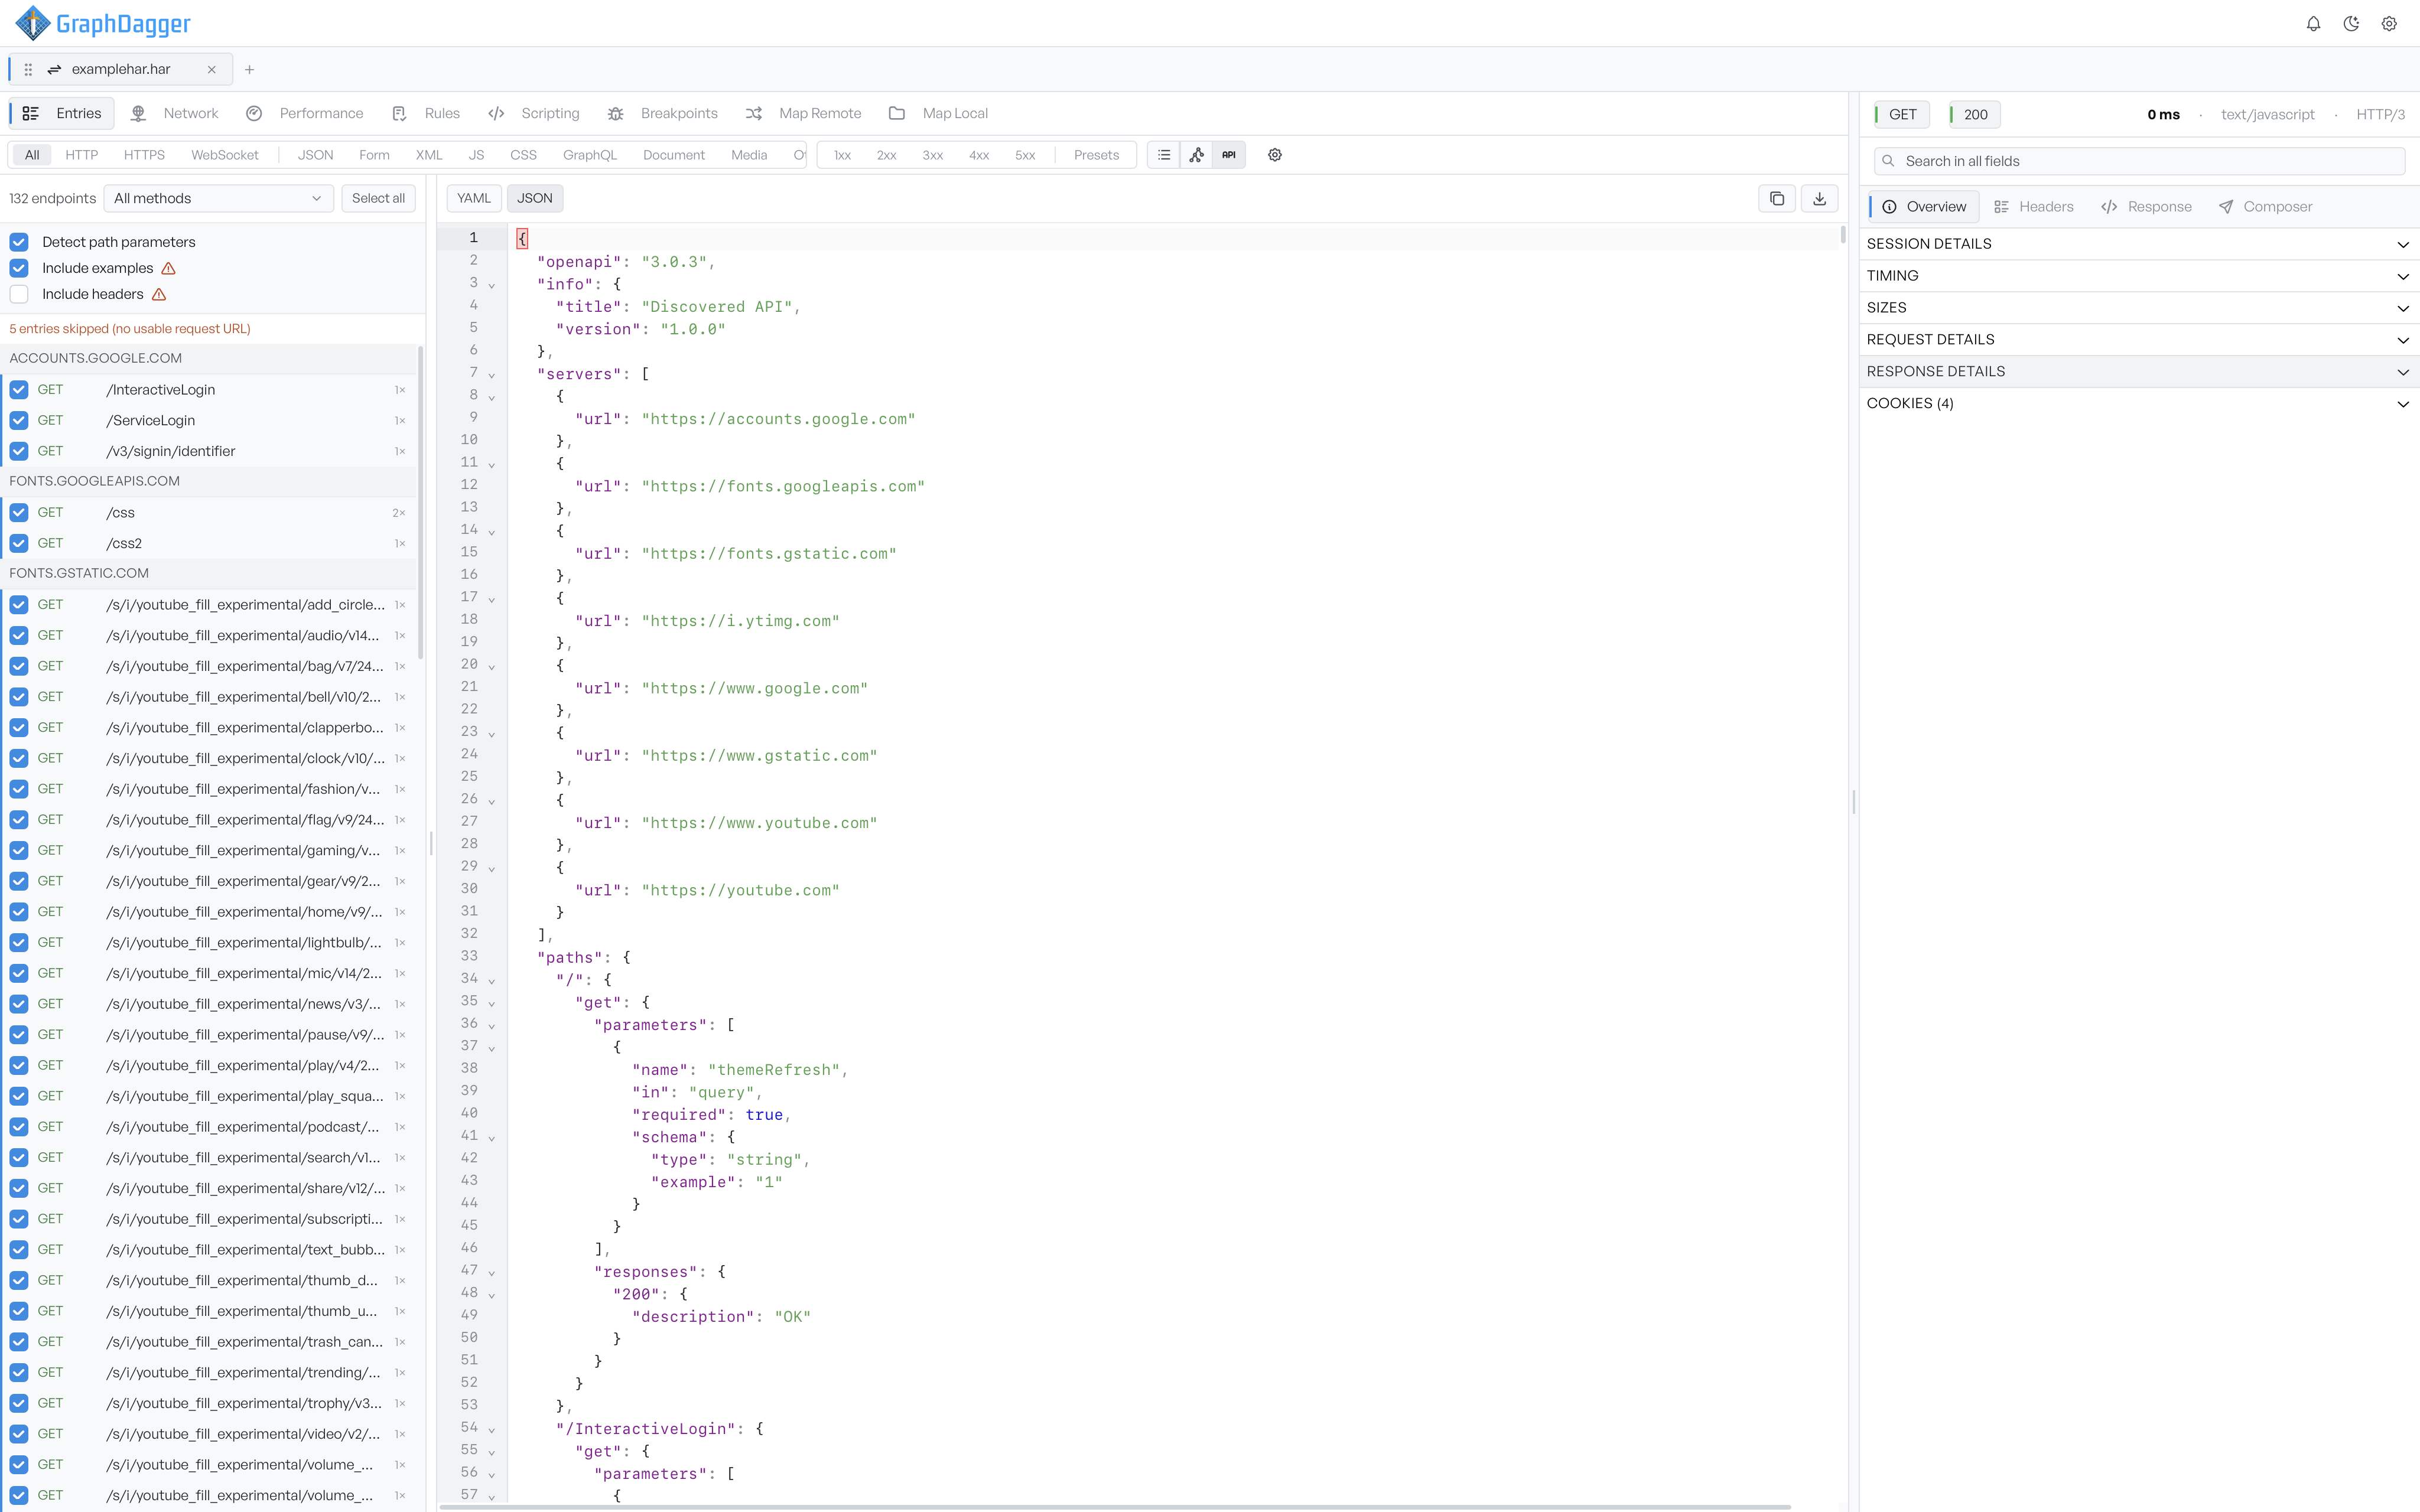
Two options control how much of the captured detail goes into the spec. Both carry a warning, because they can copy sensitive values into the file:
- Include examples, on by default, writes captured values into the spec as example data. GraphDagger flags it because those values can include tokens or personal data.
- Include headers, off by default, adds request headers to the spec. GraphDagger flags it because headers can carry authentication tokens.
If you plan to share the spec, leave these off, or check the output before you send it on.
Export the spec#
The generated document is read-only. A YAML and JSON toggle switches the format. YAML is the default. The document is an OpenAPI 3.0.3 description with the title Discovered API. It has a servers list from the hosts in the capture, and a path for each endpoint.
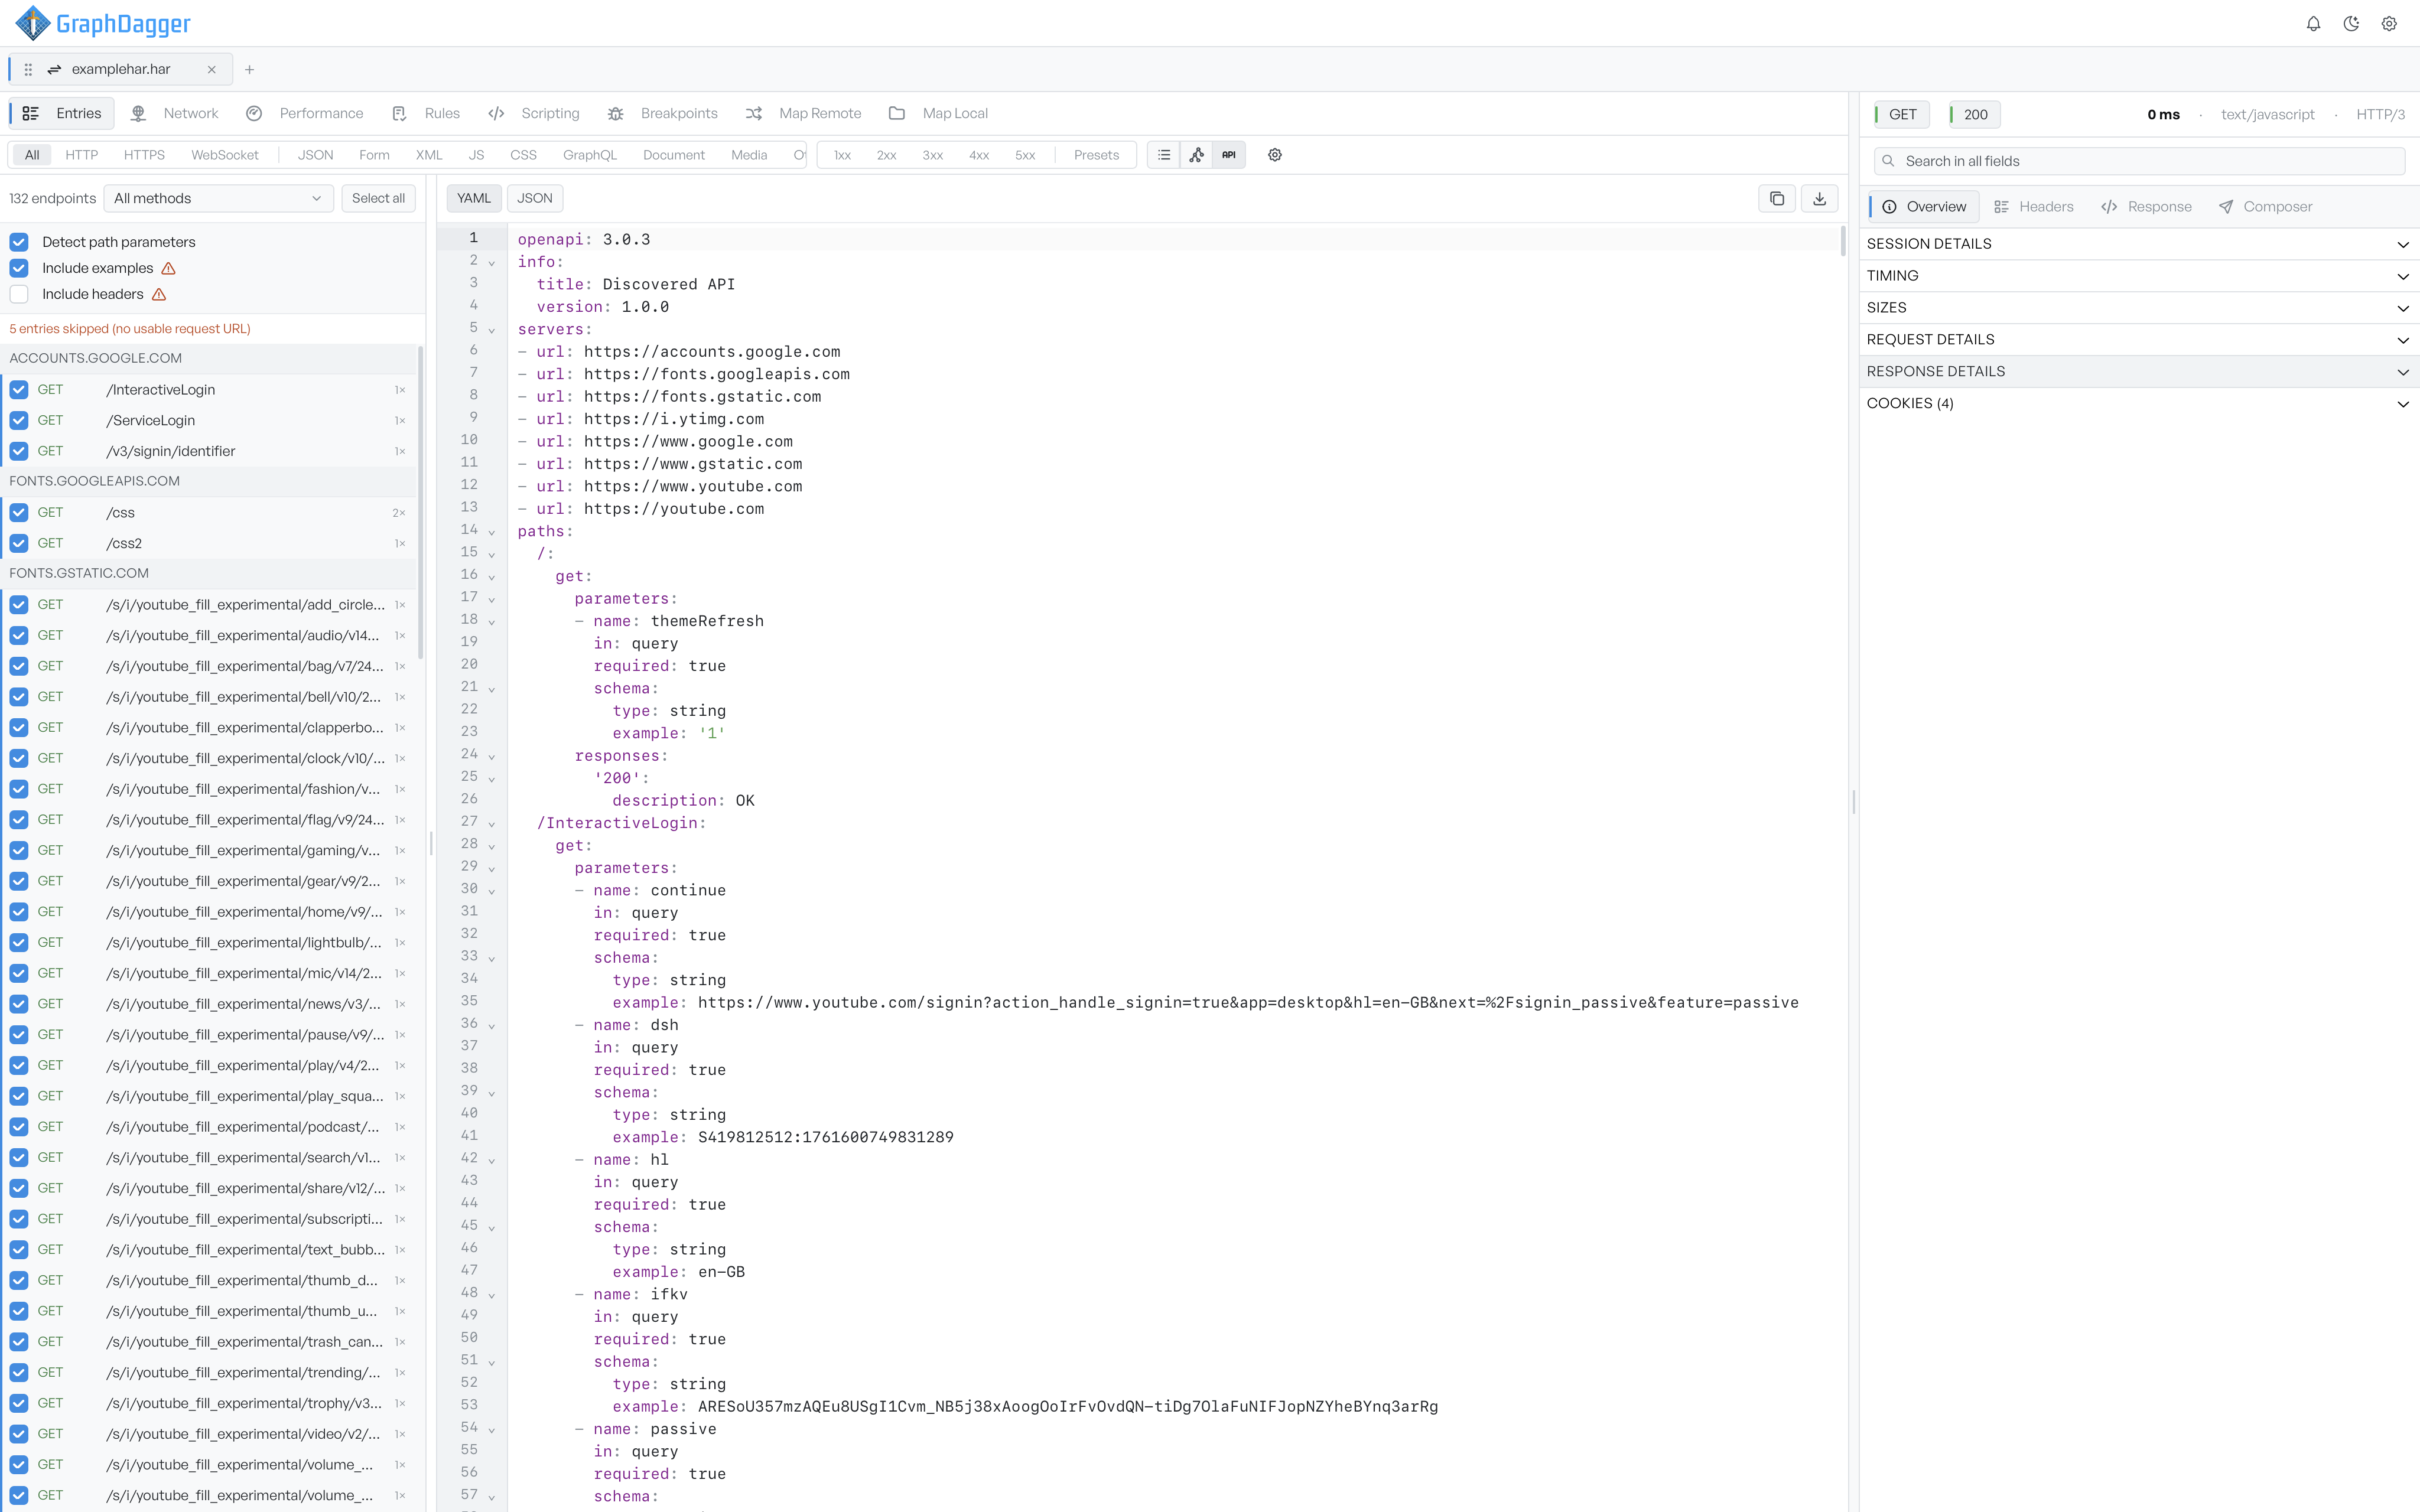
Two actions export the document. Copy spec puts the current document on the clipboard in the format you are viewing. Save spec to file writes it out, as openapi.yaml or openapi.json to match the toggle.