Read the inspector Overview tab#
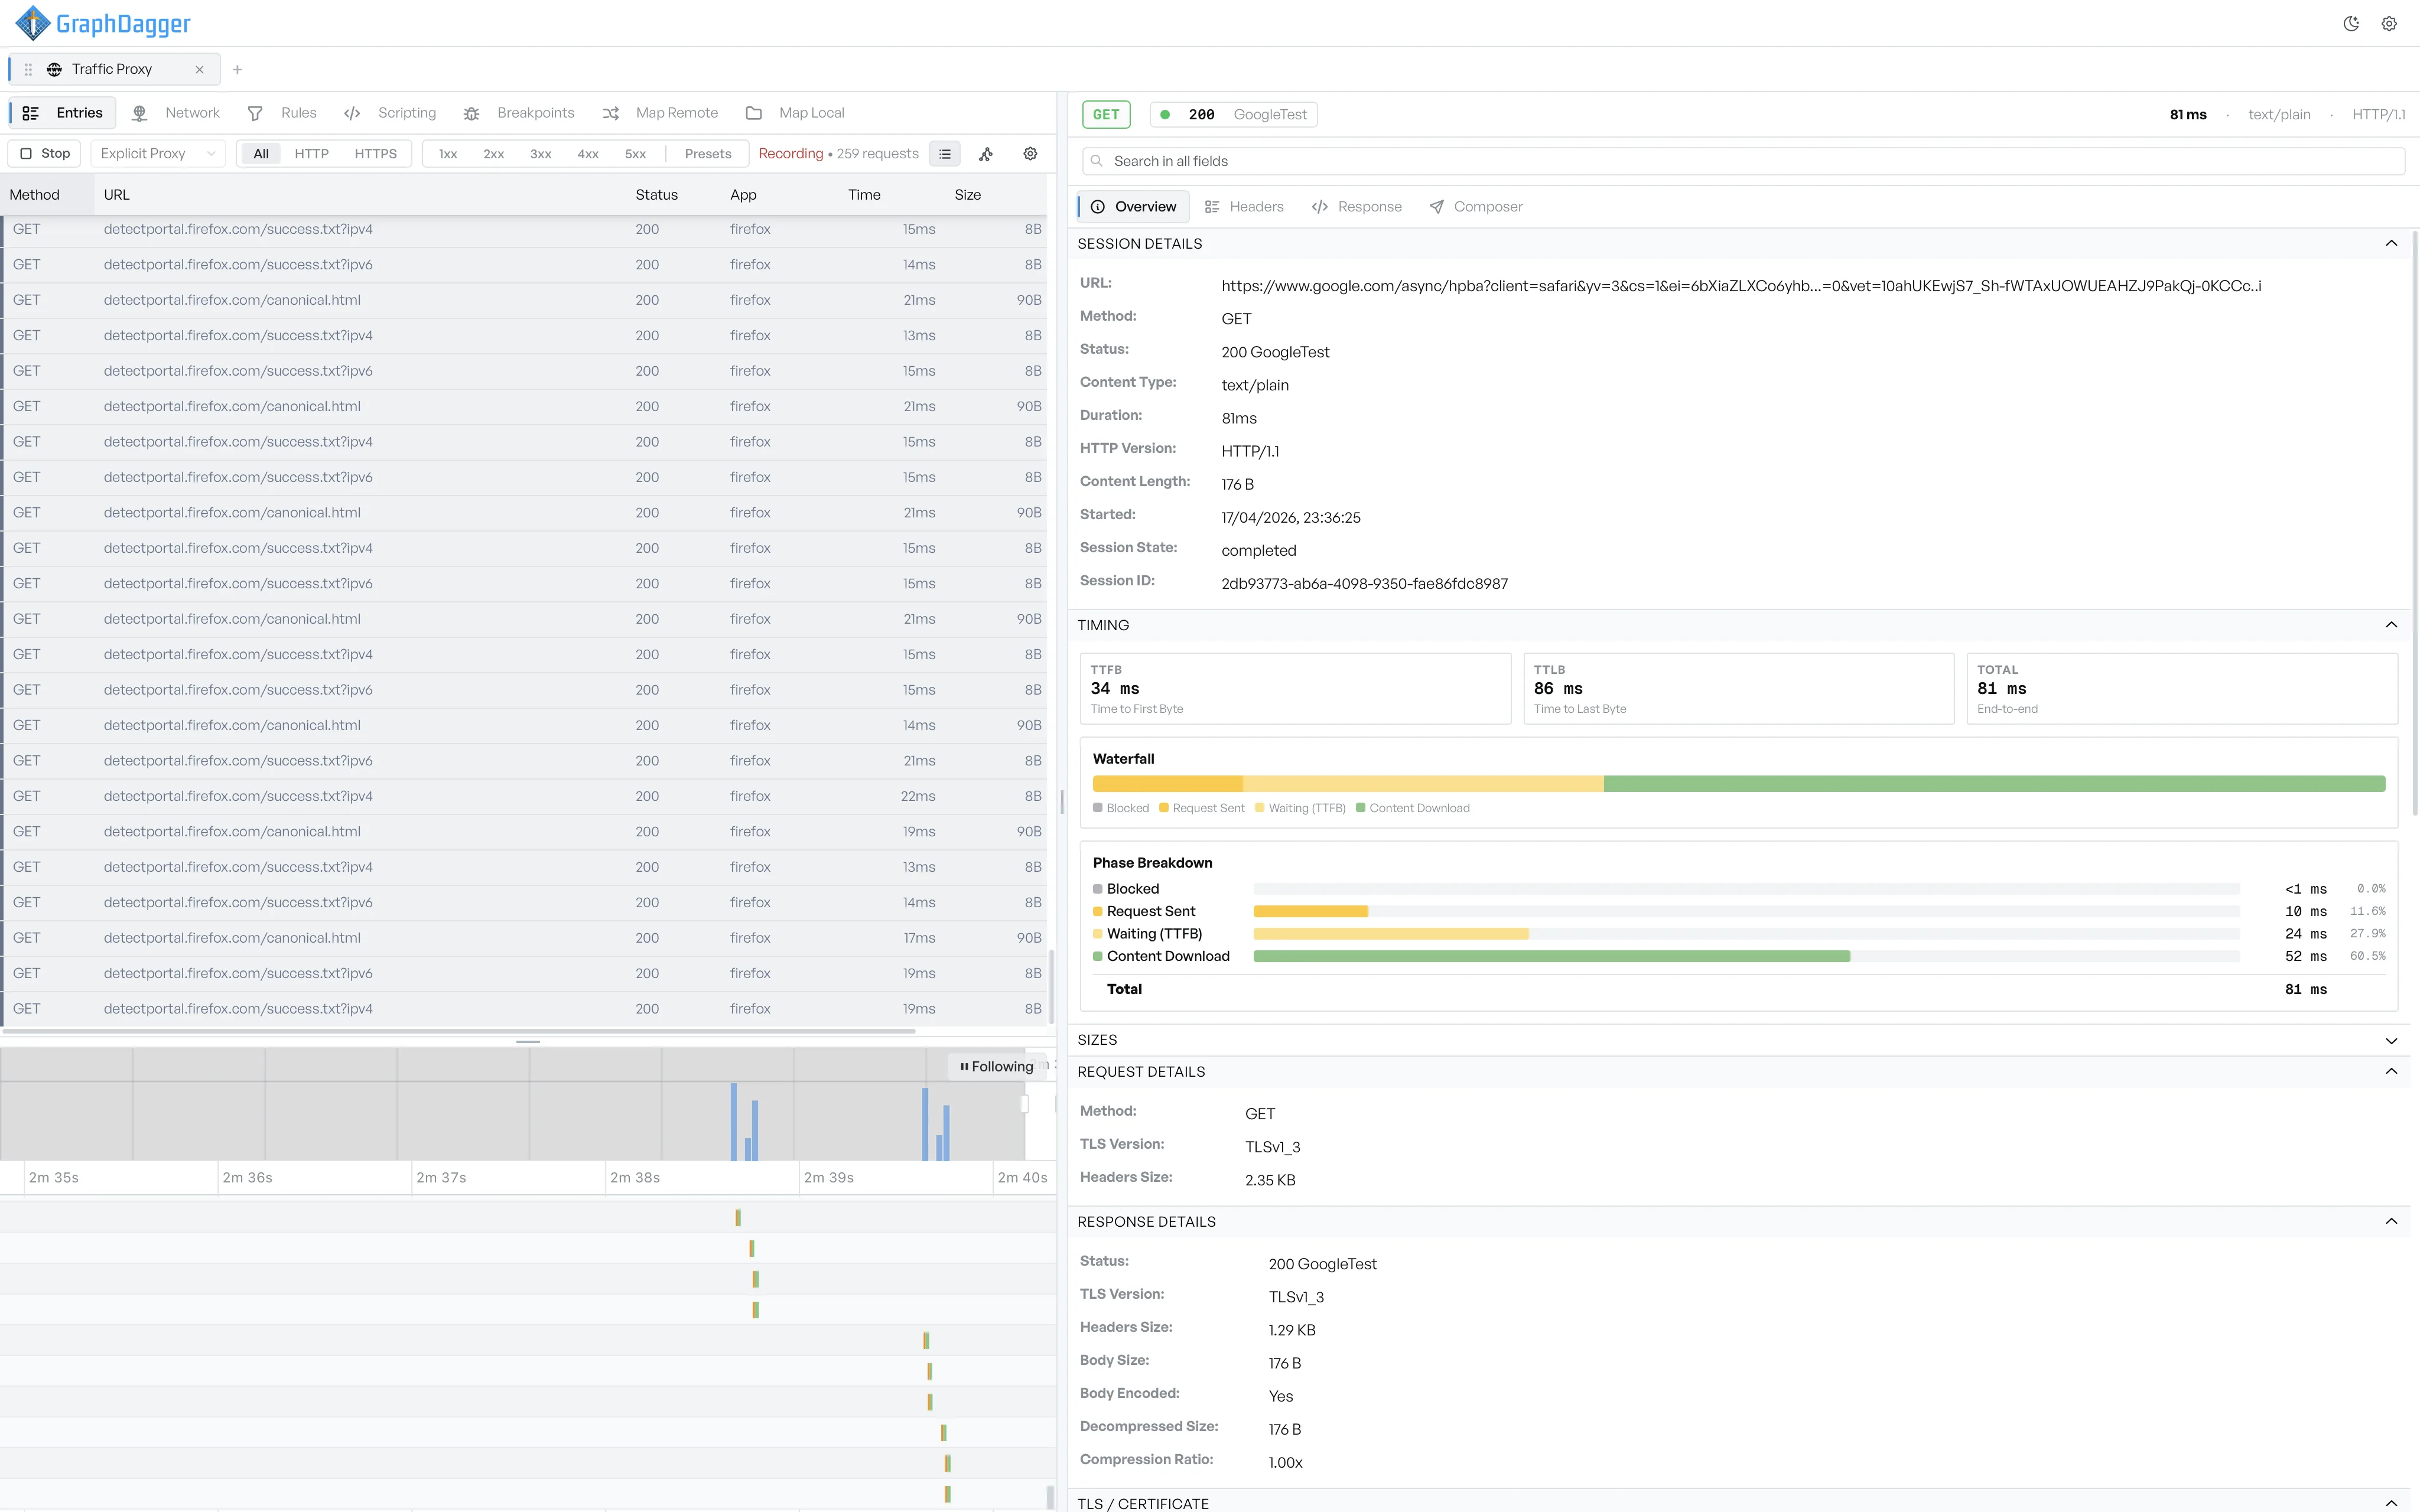
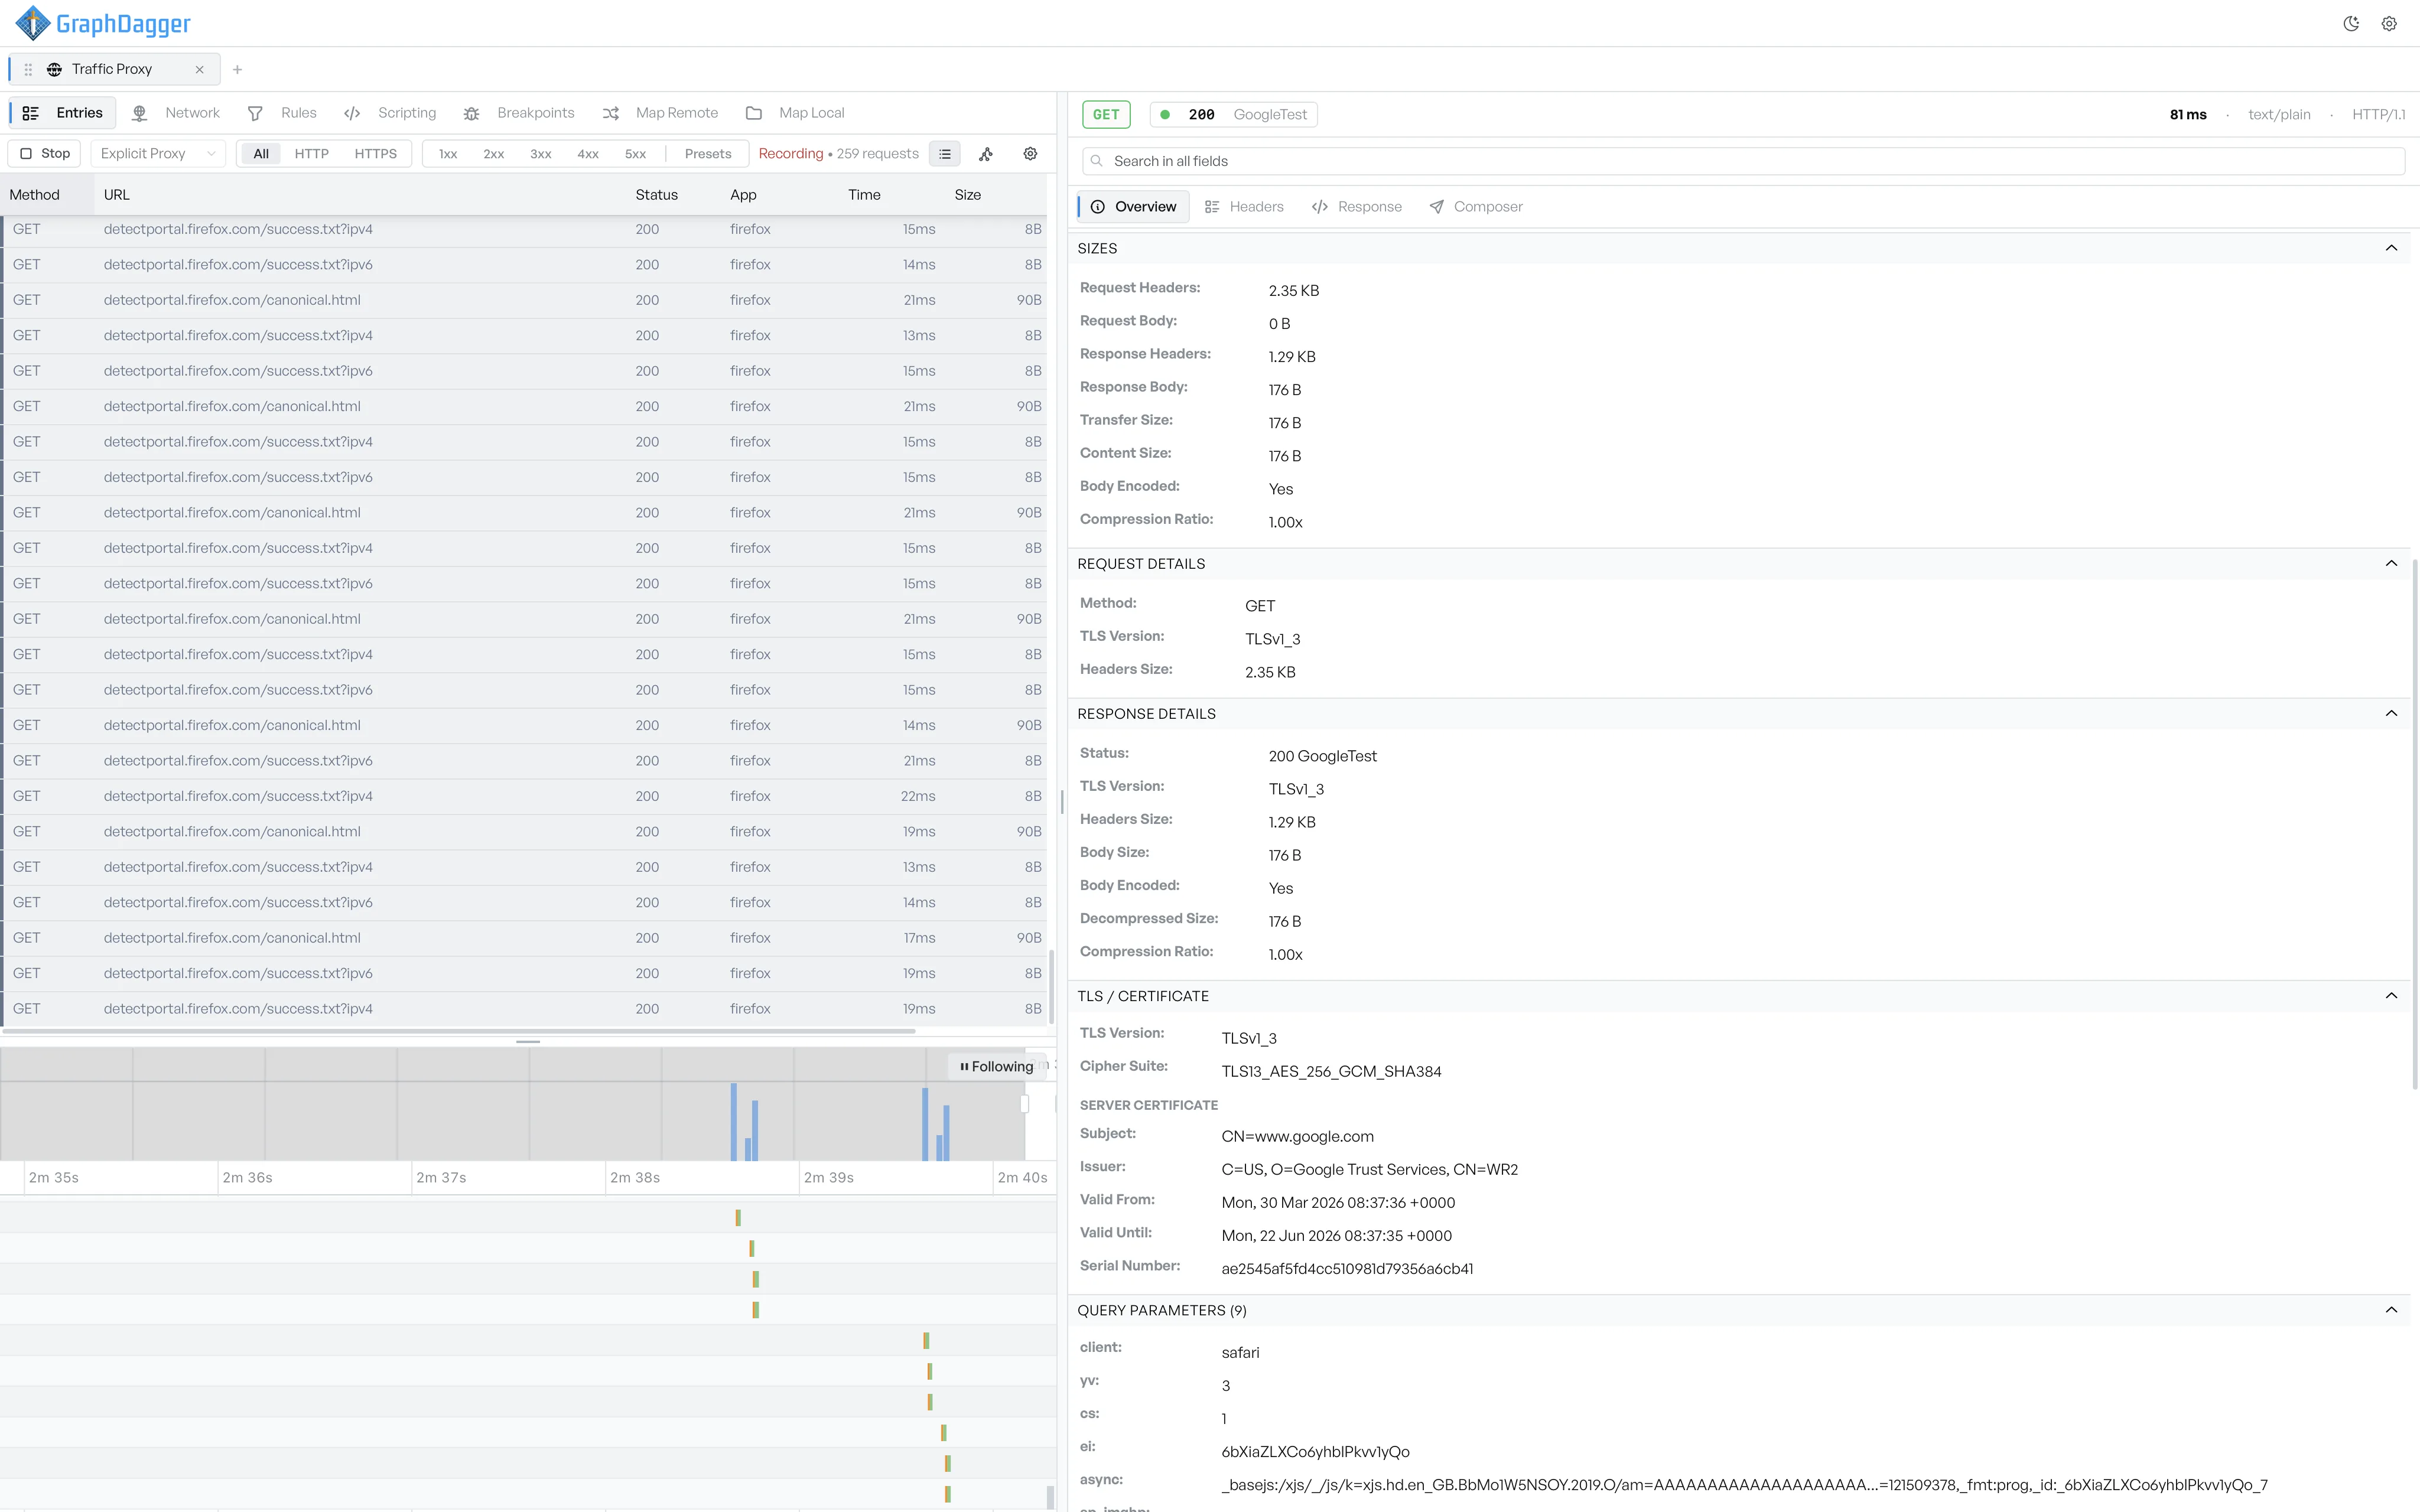
One stack of collapsible sections covers the session details, timing waterfall, sizes, TLS certificate, query parameters, and cookies.
The Overview tab is the default view in the inspector. It is a stack of collapsible sections. The sections cover everything about the selected request that does not need its own tab.
What each section shows#
- Basic info: URL, method, status, content type, duration, HTTP version, content length, and start time.
- Timing: three cards (TTFB, TTLB, Total) followed by a four-colour waterfall bar (Blocked, Request Sent, Waiting (TTFB), Content Download). Underneath, a Phase breakdown lists the milliseconds and percentage spent in each phase, plus a total.
- Sizes: request headers, request body, response headers, response body, transfer size, content size, body size, body-encoded flag, and compression ratio.
- Request details and Response details: method, TLS version, header and body sizes, and compression status for each side.
- TLS / certificate: the negotiated TLS version, cipher suite, and the full server certificate (subject, issuer, valid-from and valid-until dates, and serial number).
- Query parameters: one row per parameter, with a count in the section header.
- Cookies: one row per cookie sent or set, with a count in the section header.
Read aggregate statistics for a selection#
When you select more than one row in the entries list, a Statistics section appears at the top of the Overview tab. It gives aggregate counts, status breakdowns, total transferred size, and total time across the whole selection.
Find text in the sections#
Enter text in the search field above the tab row to highlight matches inside the Overview sections. Sections that contain a match auto-expand. Sections that do not match collapse, so the matches are easier to scan.