Check reach and network path#
An HTTP request and two pings tell you whether the target answers at all, and the traceroute drawing shows every router the traffic crosses to get there.
The last two sections do not ask what the records say. They check what happens: does the host answer, and what does the traffic cross to reach it.
Read the HTTP and ping checks#
Two checks run together. An HTTP request reports the status code the target returned, and two ICMP echoes report whether the host replies to a ping and how quickly.
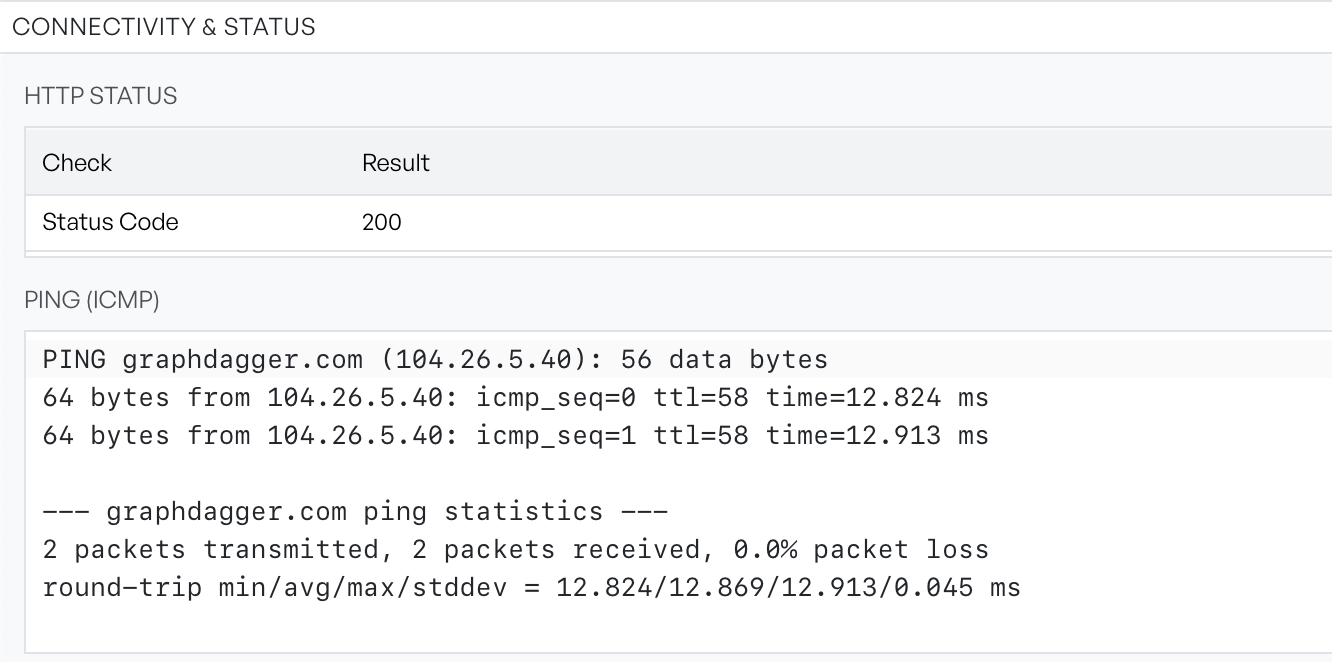
The ping result is the raw transcript. It includes the per-packet lines and the summary of packets sent, received, loss, and round-trip times. The section shows it verbatim rather than summarised, so nothing is lost in translation.
Read the two together, because they fail independently and the combination is the diagnosis. An HTTP answer with a ping timeout is extremely common and almost never a fault: many networks drop ICMP at the edge and serve traffic normally. A ping answer with an HTTP failure points at the service rather than the host. Two failures point at the host or at the route to it.
Either half can come back empty on its own. The HTTP row reads Not checked or failed, and the ping block reads Ping failed or timeout.
Read the traceroute drawing#
The traceroute section maps the route from your machine to the target, one hop per router along the way.

The first node is always your own machine, labelled Local, and the last is the target.
Hop detail arrives in two stages. Addresses and latencies appear as soon as the trace returns. Hostnames and network operators then fill in behind them, a few hops at a time. Names that appear after the path is drawn are expected. A hop whose name does not resolve turns yellow and reports that the lookup failed. This affects only the label, not the route.
A hop that never replies is drawn as a red warning triangle and reads no reply, and the edges on each side of it turn dashed. This is normal. Many routers do not answer the probes traceroute relies on. A silent hop mid-path means the packet passed through something that declined to identify itself, not that the route broke. The summary strip counts these hops, so a path can legitimately report several no-reply hops and still reach its target.
The strip at the top left gives the hop count and the latency to the target. Select any node to open a panel with that hop's address, latency, operator, and hostname.
Zoom with the scroll wheel and drag to pan. Select empty space to clear the selection.
Note The filter box at the top of the workspace applies to this section as well, and it removes hops from the drawing rather than dimming them. A filtered path is a partial path, so clear the filter before reading a route.