Read amplitude and strings#
Peak and RMS figures track whatever range is on screen, while the strings table lists every printable run found in the raw container bytes.
Measurements answers two questions at once. How loud is this part of the recording, and what readable text sits in the file? The amplitude figures track whatever is on screen, so they change as you move around the recording. The strings come from the whole container, whatever you select.
There is nothing to run. Open the tab, and the figures are already there.
Read peak and RMS#
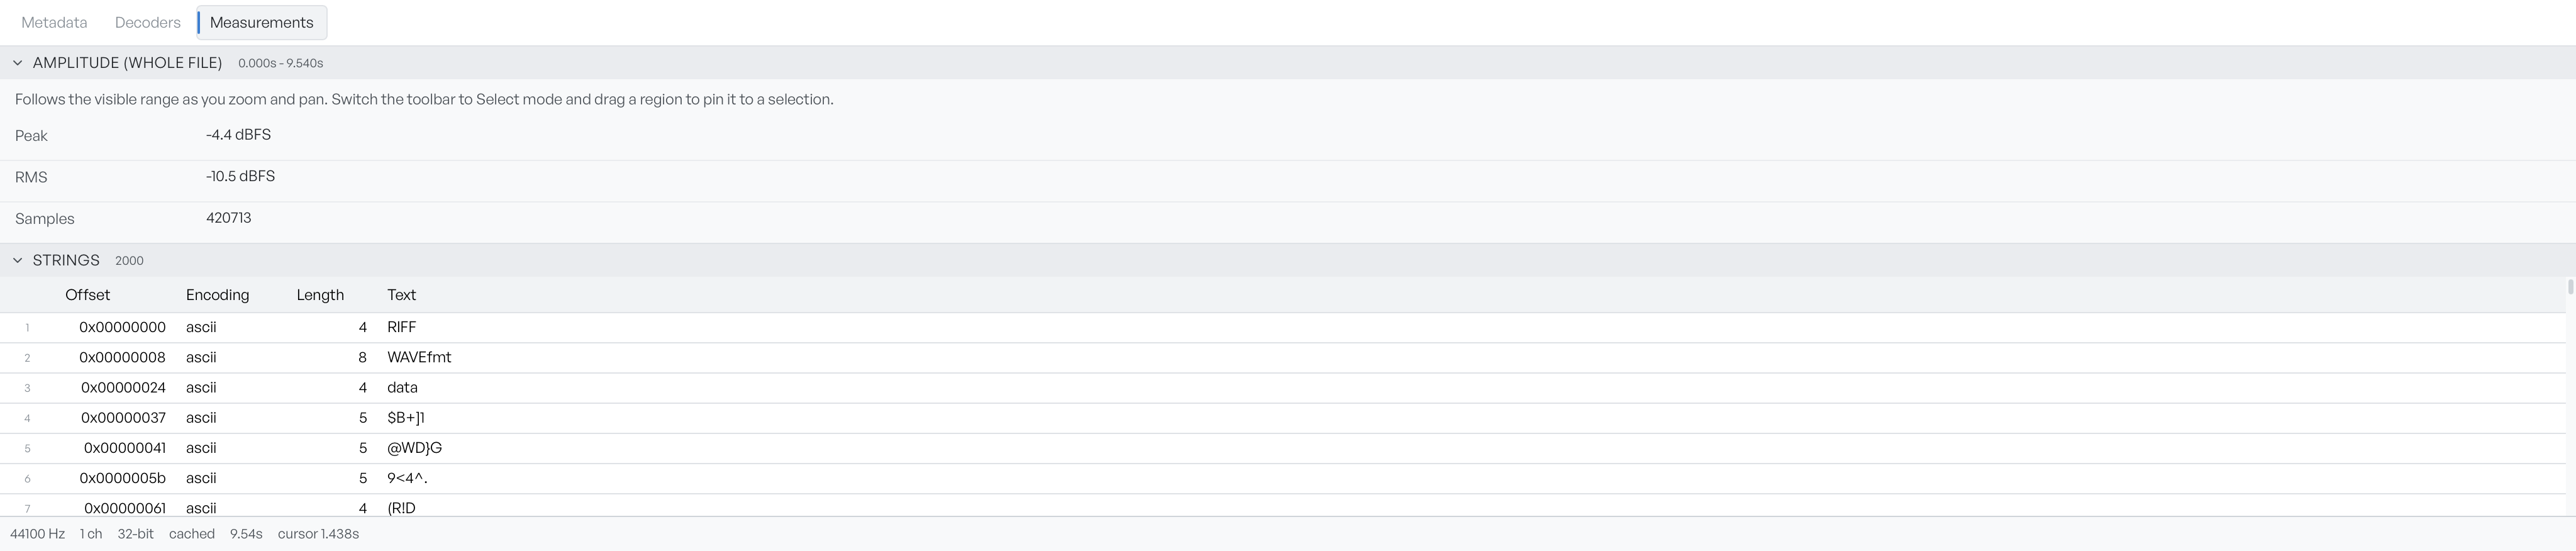
The Amplitude section reports three figures.
- Peak: the loudest single sample in the range, in decibels relative to full scale.
- RMS: the average energy across the range, on the same scale.
- Samples: how many samples the app measured, which confirms the range is the size you thought.
The gap between peak and RMS is the useful part. A wide gap means occasional spikes over a quiet bed. A narrow gap means something sustained or compressed.
The section heading names the range the figures cover, and the badge beside it gives the exact start and end. The heading reads whole file when you zoom out, view once you zoom in, and selection once you mark a region. While the app works out a new figure, the badge reads measuring.
Zoom into a burst of tones, and the numbers describe that burst. Pin a region with a Select drag, and the numbers stay on it while you carry on zooming. Use this to compare two parts of a recording without loss of your place. Navigating the timeline covers both.
The channel chosen on the toolbar decides what the app measures on a multi-channel file.
Read the strings table#
The Strings section lists printable text found in the raw container bytes. Each row gives the byte offset where the run starts, the encoding, the length in characters, and the text itself. The app ignores runs shorter than four characters, and the scan stops at 2000 results.
The first few entries are usually structural: the RIFF, WAVEfmt and data markers of a WAV file. Read anything past those properly. The app lists ASCII runs first, then any UTF-16LE runs.
Select a column heading to sort by it. Select it again to reverse the order, and a third time to go back to the order the scan found. The funnel on each heading filters: by range on offset and length, by encoding, or by matching text. A filter on text is the quickest way through a long list when you know part of what you want. Right-click a row to copy a single value, or the row as JSON.
The offset is a byte position in the file, so you can take it straight to a hex editor. If the offsets suggest something hides in the sample data rather than the header, LSB extract pulls payloads out of the samples themselves.