What Audio Inspector reads#
A recording is drawn as a waveform and a spectrogram at once, and every action in the workspace points at a time range you choose.
Audio Inspector takes a sound file apart. It draws the signal in two ways at once: a waveform shows loudness over time, and a spectrogram shows which frequencies are present at each moment. It also reads the file itself: the container structure, the bytes in the low bits, and the tones that carry text or pictures. You bring it a recording you do not trust, and it tells you what is in there.
Hold on to one idea: everything in the workspace points at a time range. Zoom to narrow what you look at. Select to mark a region. Then run a decoder or a measurement over that region.
Open an audio file#
Open a new tab and select Audio Inspector. An empty workspace shows a drop zone.
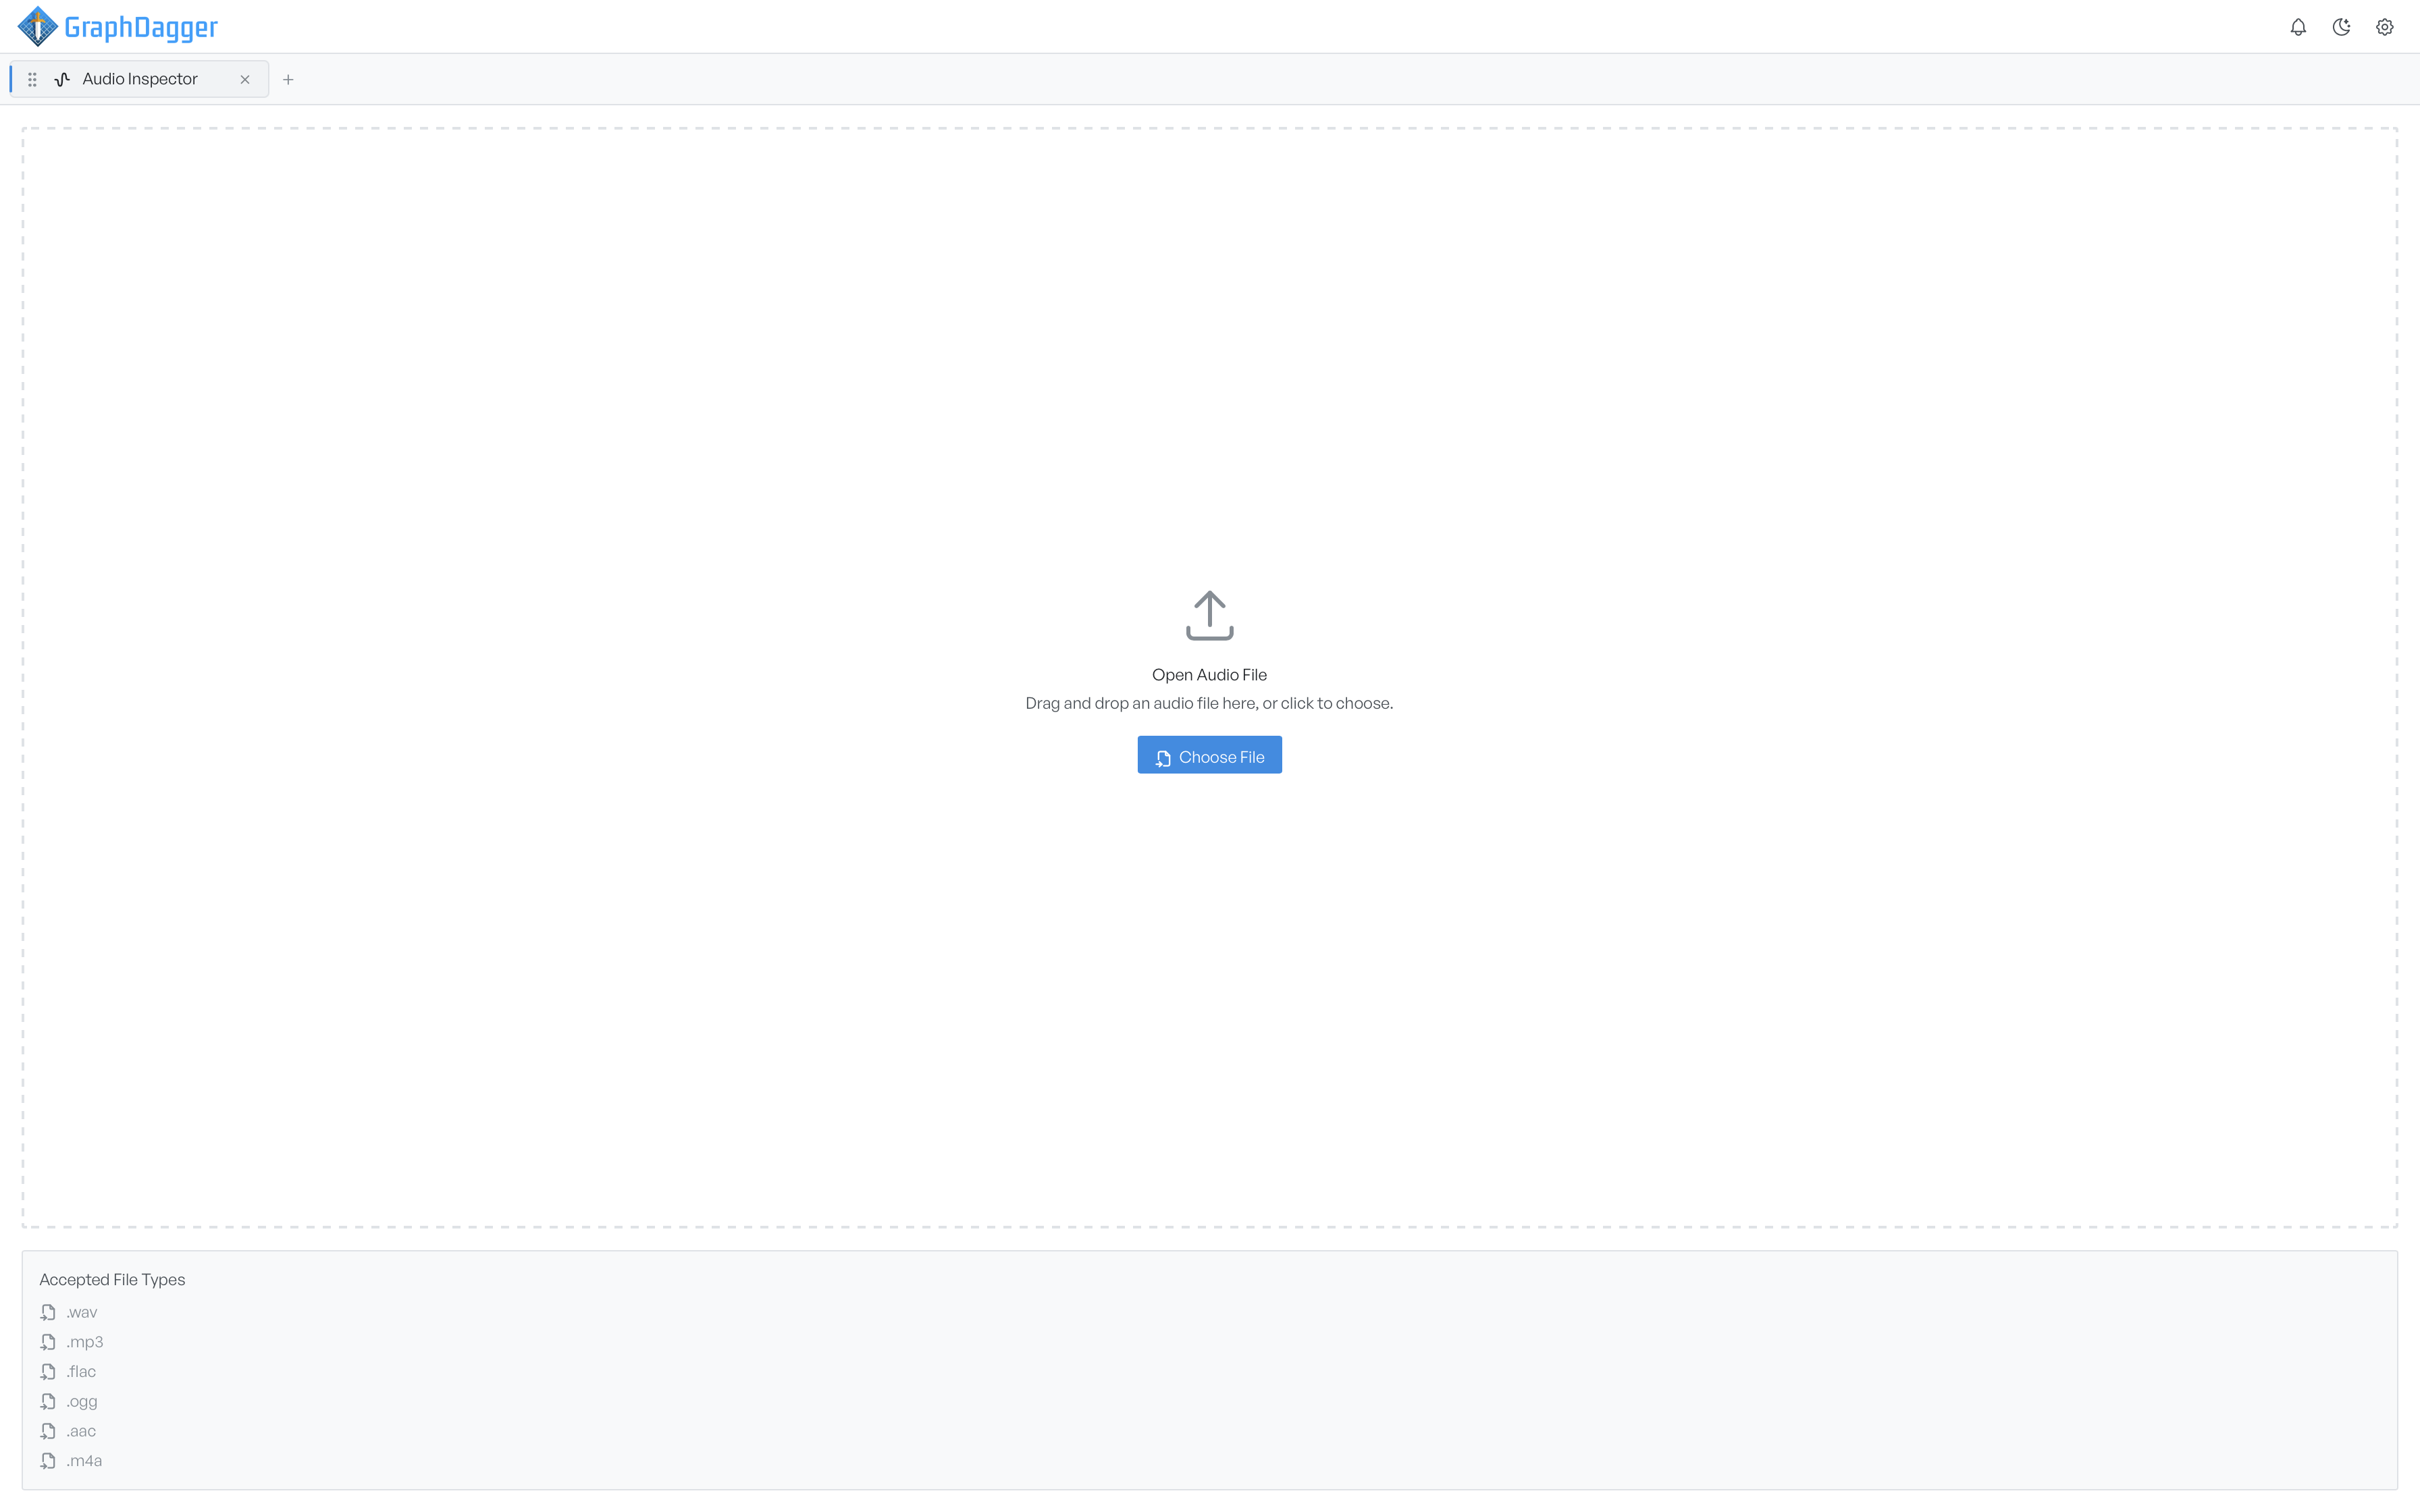
Drag a file onto the drop zone, or select Choose File. The panel underneath lists the accepted formats: .wav, .mp3, .flac, .ogg, .aac, and .m4a. The tab takes the file name after the file decodes.
The four workspace regions#
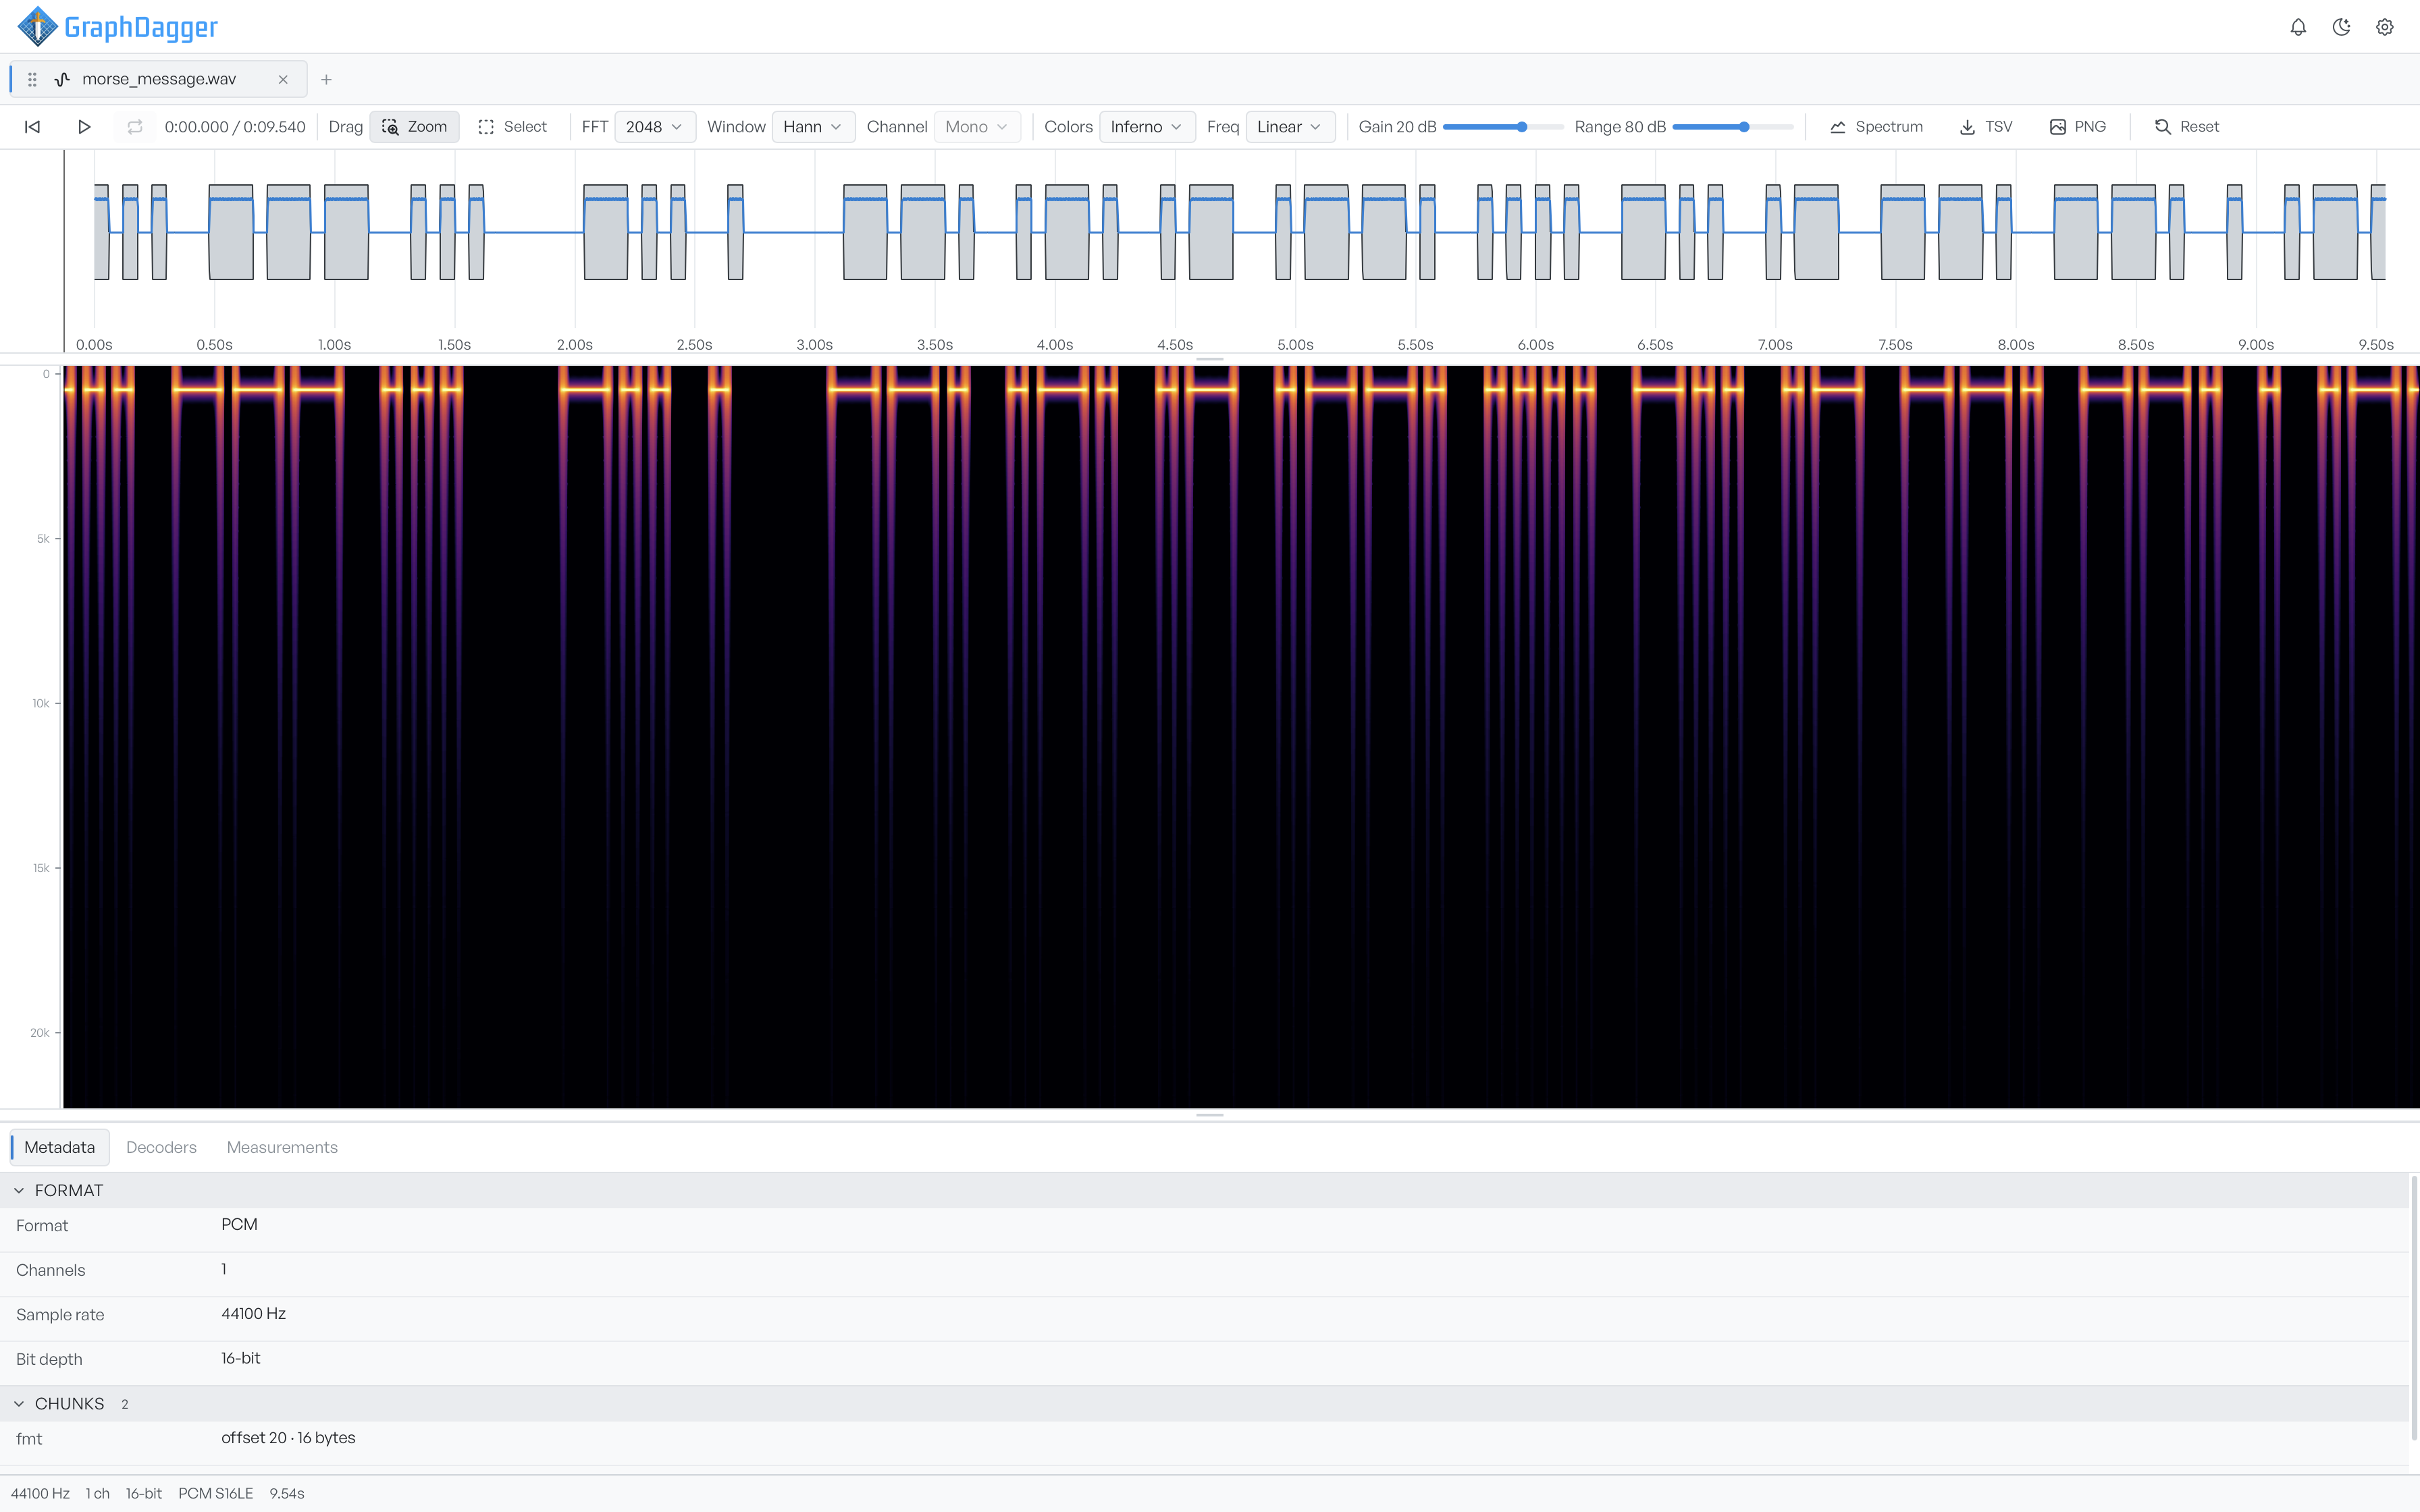
The waveform strip shows the whole signal envelope. The spectrogram plots frequency down its left edge, time from left to right, and brightness for energy. The status bar reports the file sample rate, channel count, bit depth, codec, and duration. It also gives live readouts for the hovered cursor time and the length of any selection.
The waveform and the spectrogram always show the same time range. Zoom one, and the other follows.
What the Analysis panel adds#
A docked panel with three tabs sits below the spectrogram. It is the forensic half of the feature. Here the file stops being a picture and becomes evidence.

Metadata reads the container structure and flags anomalies in it. It runs on its own as soon as a file loads. Decoders pull telephone tones, Morse, slow-scan images, and hidden payloads out of the audio. Measurements reports amplitude figures and the printable strings in the file.
The panel opens at a quarter of the workspace height. Drag its top edge to resize it. Drag it all the way down to close it.
Where to go next#
- Navigating the timeline covers zoom, selection, and playback.
- Display settings covers the analysis and rendering controls on the toolbar.
- The spectrum panel covers how to read a single moment as a frequency curve.
- Exporting covers how to save the spectrogram and spectrum out of the app.