Roll events into transactions#
Move from one row per event to one row per user, session, or identifier, each with a count, a duration, and its first and last timestamps.
The Transactions mode of Group into rolls related events up into a single transaction per key. It attaches a count, a duration, and first-seen and last-seen timestamps. Use it to move from "one row per event" to "one row per session, user, request, or other identifier" without a SQL query. Switch the Group into pill on the query bar to Transactions to enter this mode.
Read the transactions table#
Each row in the table is a transaction. By default, the key is the grouping field you select in the by pill of the query bar, for example cs_username.
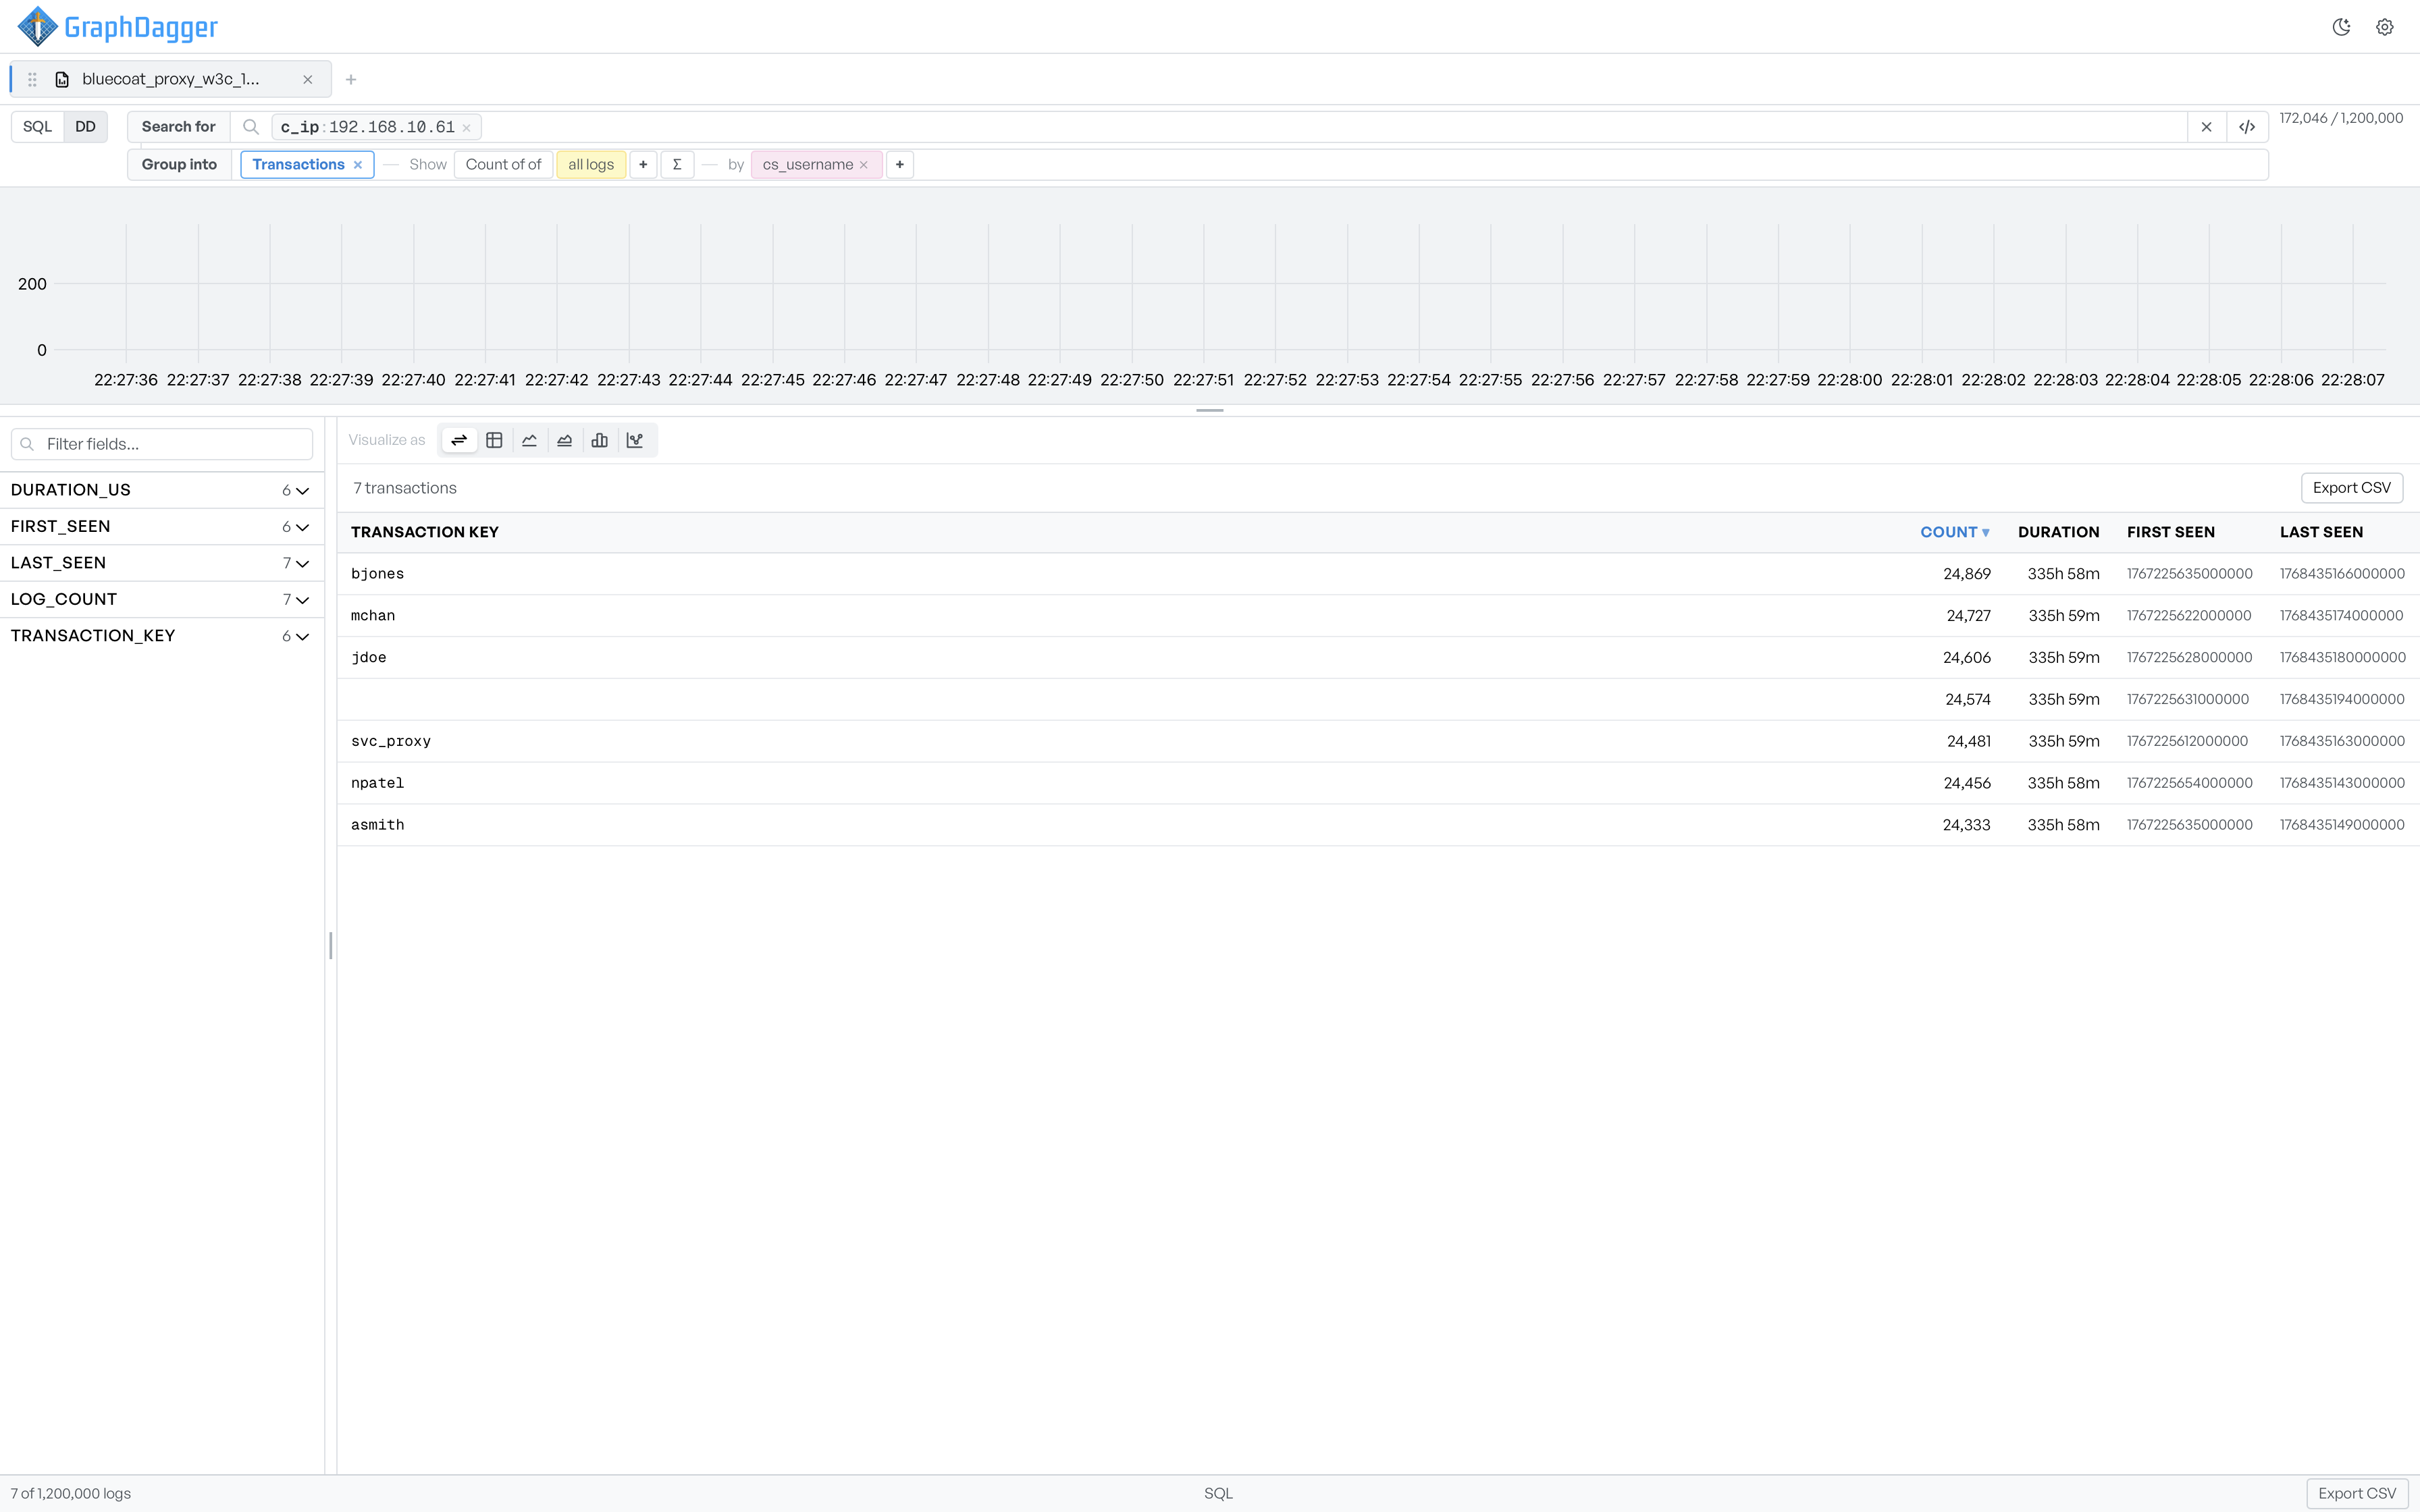
| Column | What it shows |
|---|---|
TRANSACTION KEY | The value of the grouping field for this transaction (for example bjones). Empty keys appear as a blank row. |
COUNT | Number of events that make up the transaction. Click the header to sort; the downward arrow shows the current direction. |
DURATION | Time elapsed between the first and last event (for example 335h 59m). |
FIRST SEEN | Timestamp of the earliest event in the transaction. |
LAST SEEN | Timestamp of the most recent event. |
The field panel on the left updates for Transactions mode. It shows facets such as DURATION_US, FIRST_SEEN, LAST_SEEN, LOG_COUNT, and TRANSACTION_KEY. Expand any of them to narrow the transactions list by duration or by a range of timestamps.
An Export CSV button appears in two places, above the table and in the status bar. Both produce the same CSV of the current transactions.
Chart a transaction breakdown#
The Visualize as row above the table applies to Transactions too. Switch to the bar chart to plot every column of the transaction table side by side, with one coloured bar per metric, for each transaction key.
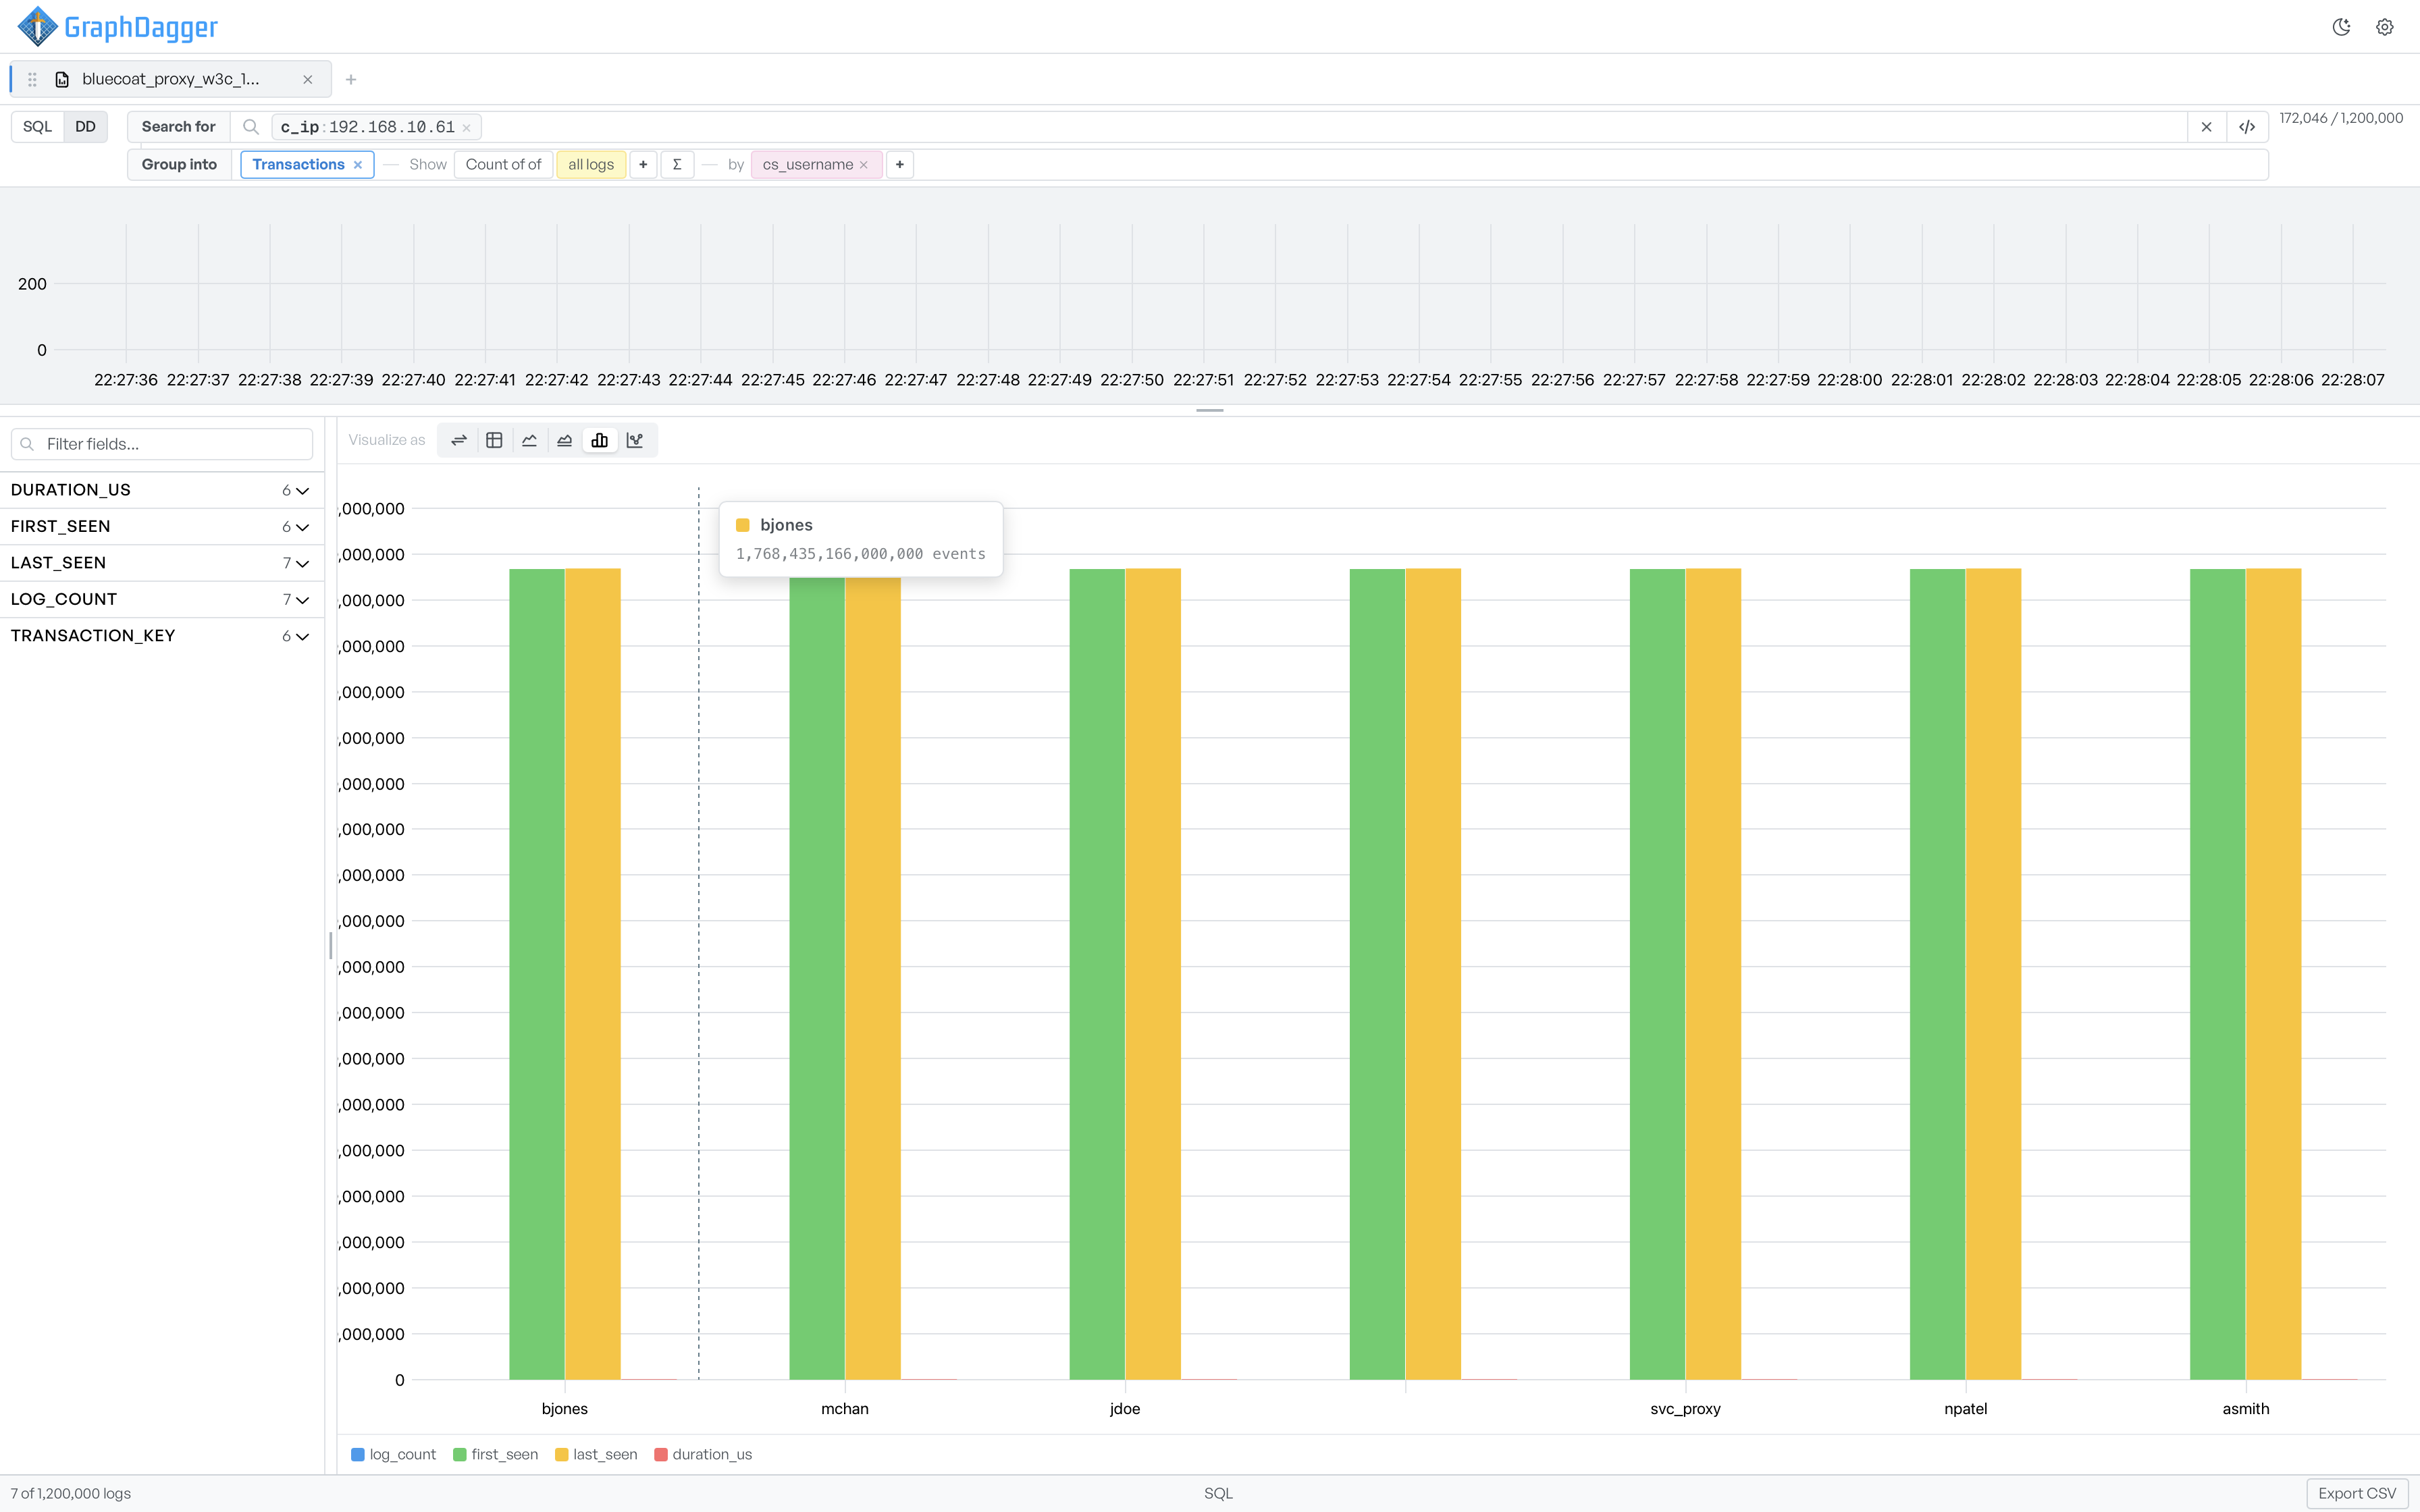
- Hover over a bar to see the transaction key and the exact metric value.
- The activity histogram at the top still reflects the event-level query, so you can watch the time shape while you read the rolled-up numbers.
Durations and epoch timestamps#
The table shows durations in hours and minutes (335h 58m). It shows timestamps as raw numeric epoch values. To filter by a specific date range instead of a read of individual values, use the first-seen and last-seen facets on the left.
Filter events before the rollup#
The Search for bar still filters the underlying events before the rollup. A query such as c_ip:192.168.10.61 restricts the transaction list to events from that IP. Every COUNT and DURATION then counts the filtered subset only. The result count at the top right, for example 172,046 / 1,200,000, is the event count that feeds the rollup. The transaction count appears below the table header, for example 7 transactions.