What Log Explorer shows#
Open one or more log files, then read the query bar, histogram, facets panel, and events table that all answer to the same query.
Log Explorer turns a raw log file into an interactive workspace. You can count, filter, group, and visualize structured events. This page explains how to open a file and what each part of the workspace does. It also points you to the pages for the specific workflows.
Open a log file#
Log Explorer stays empty until you load a file.
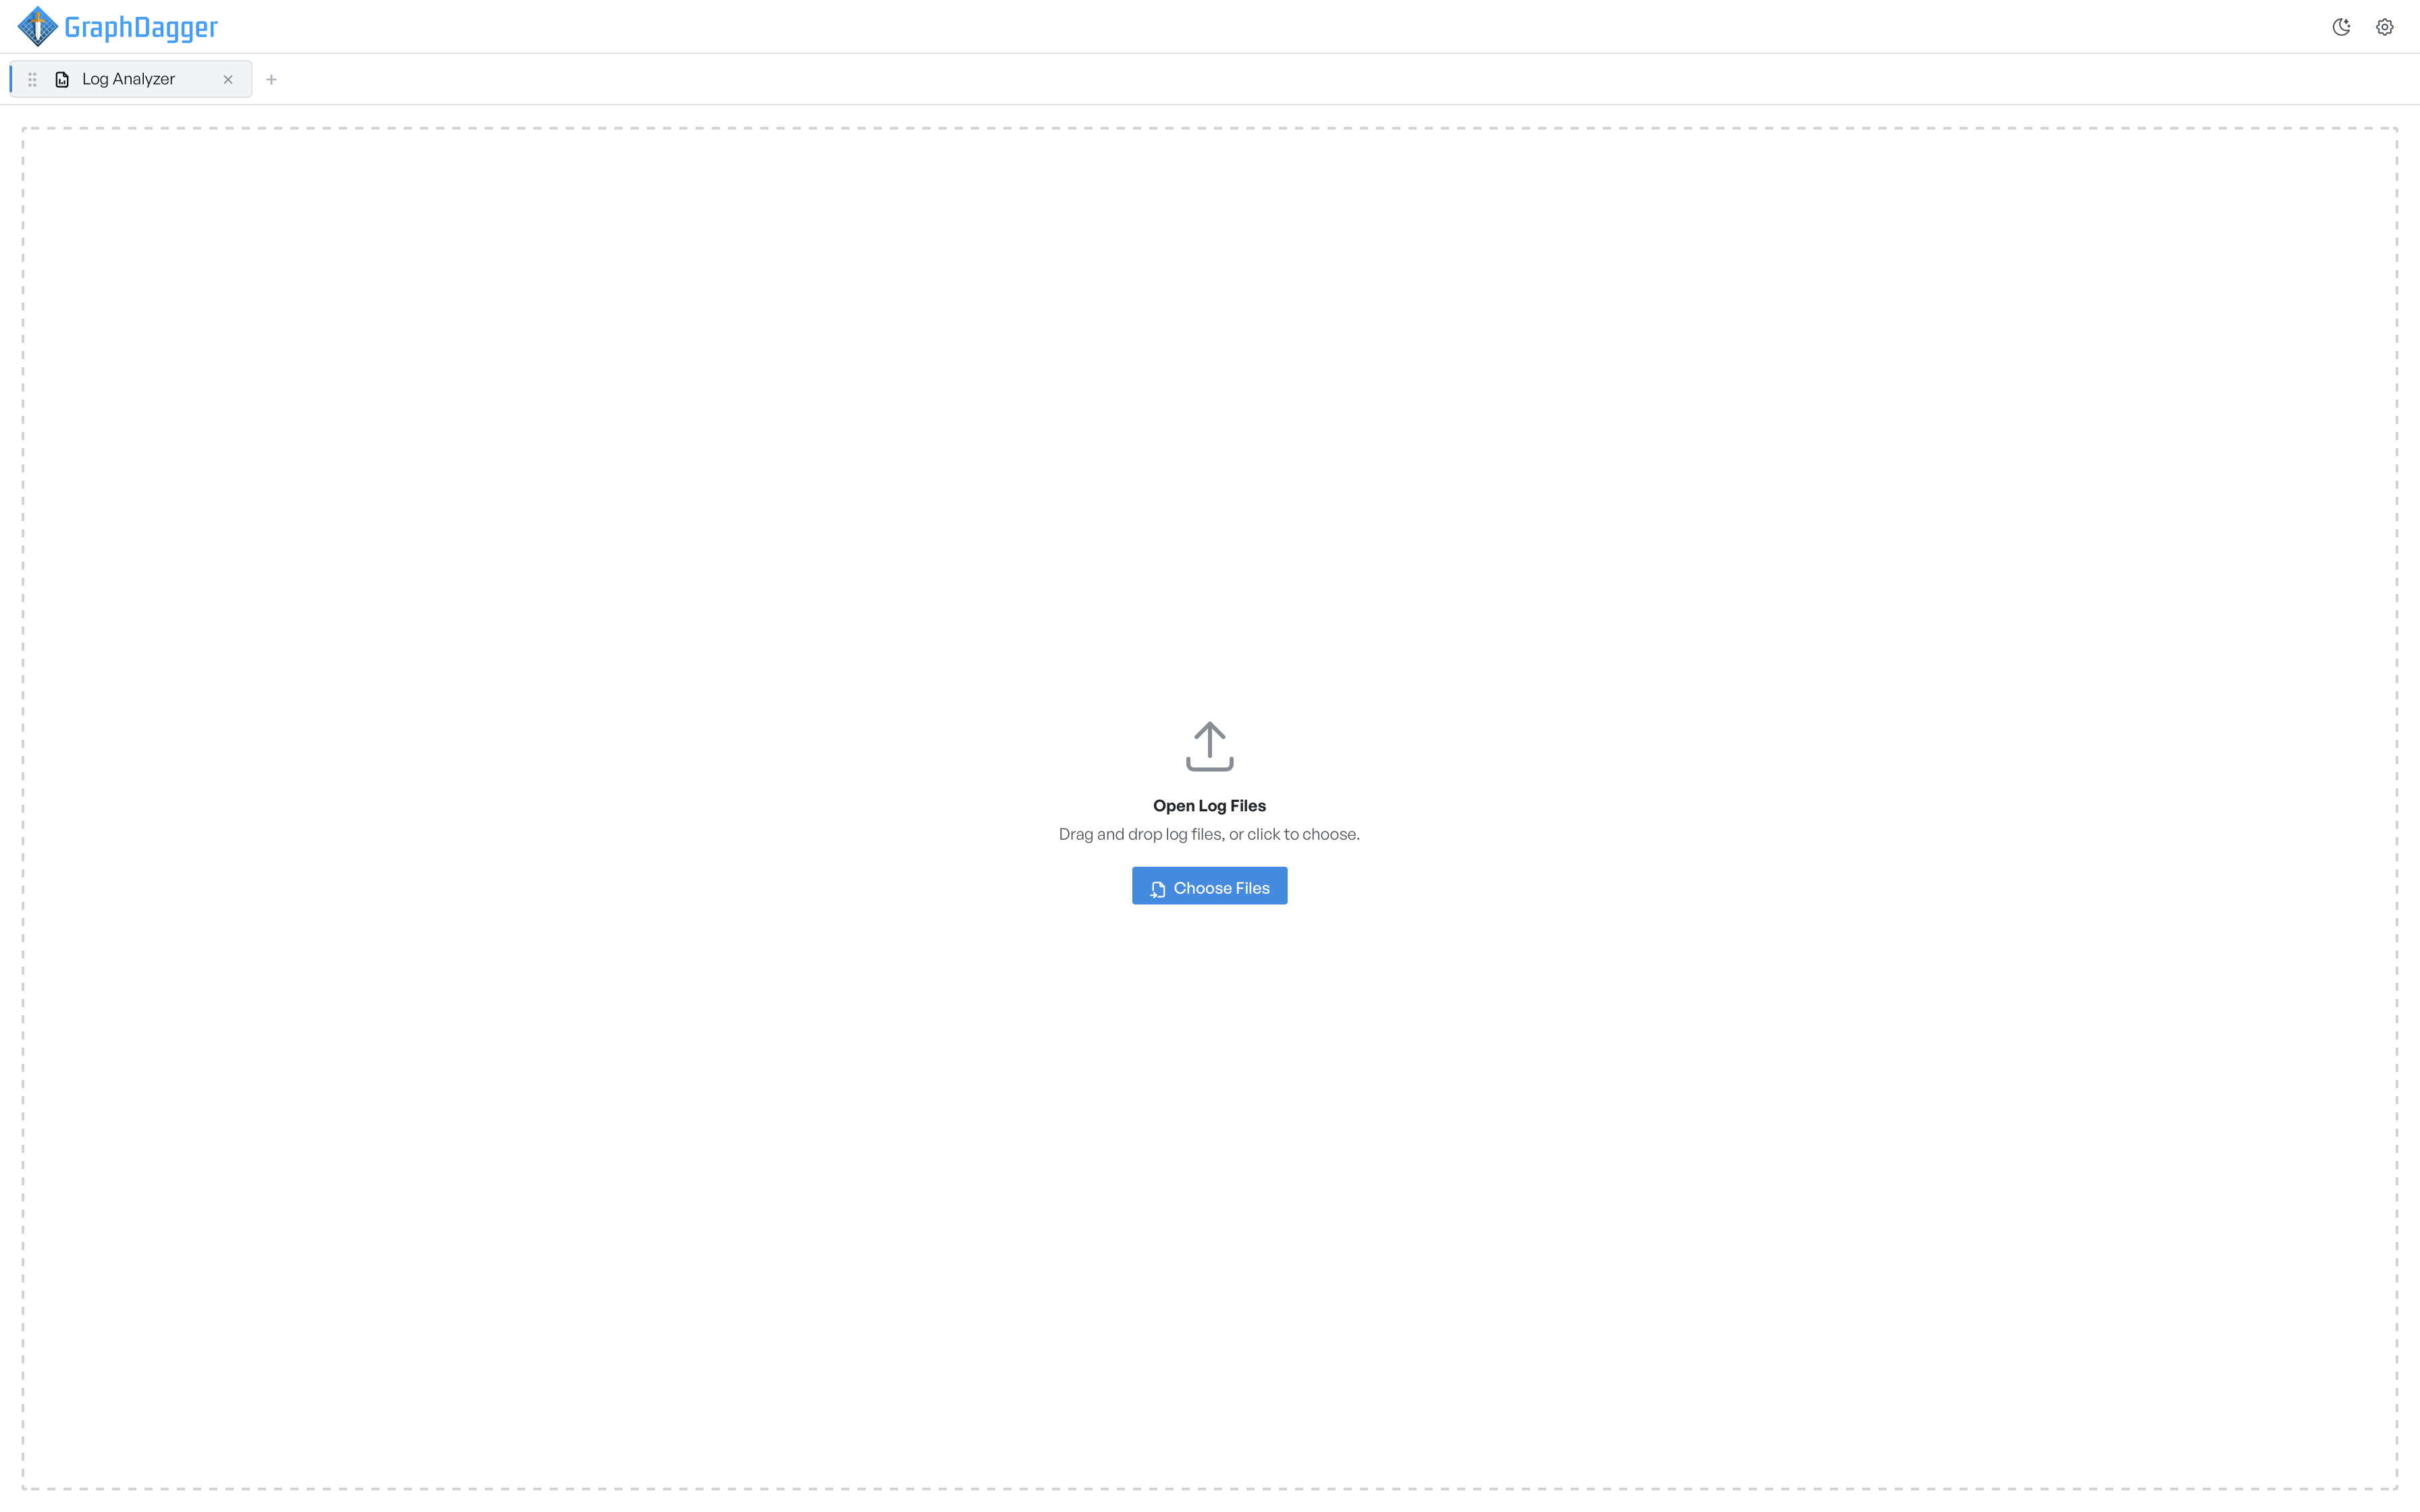
You can load logs two ways:
- Drag and drop one or more log files into the dashed drop zone.
- Select Choose Files and pick files from your system file picker.
Each loaded file opens in its own tab at the top of the workspace. The tab takes the name of the file. You can keep several log files open at the same time. Select a tab to switch between them.
The workspace regions#
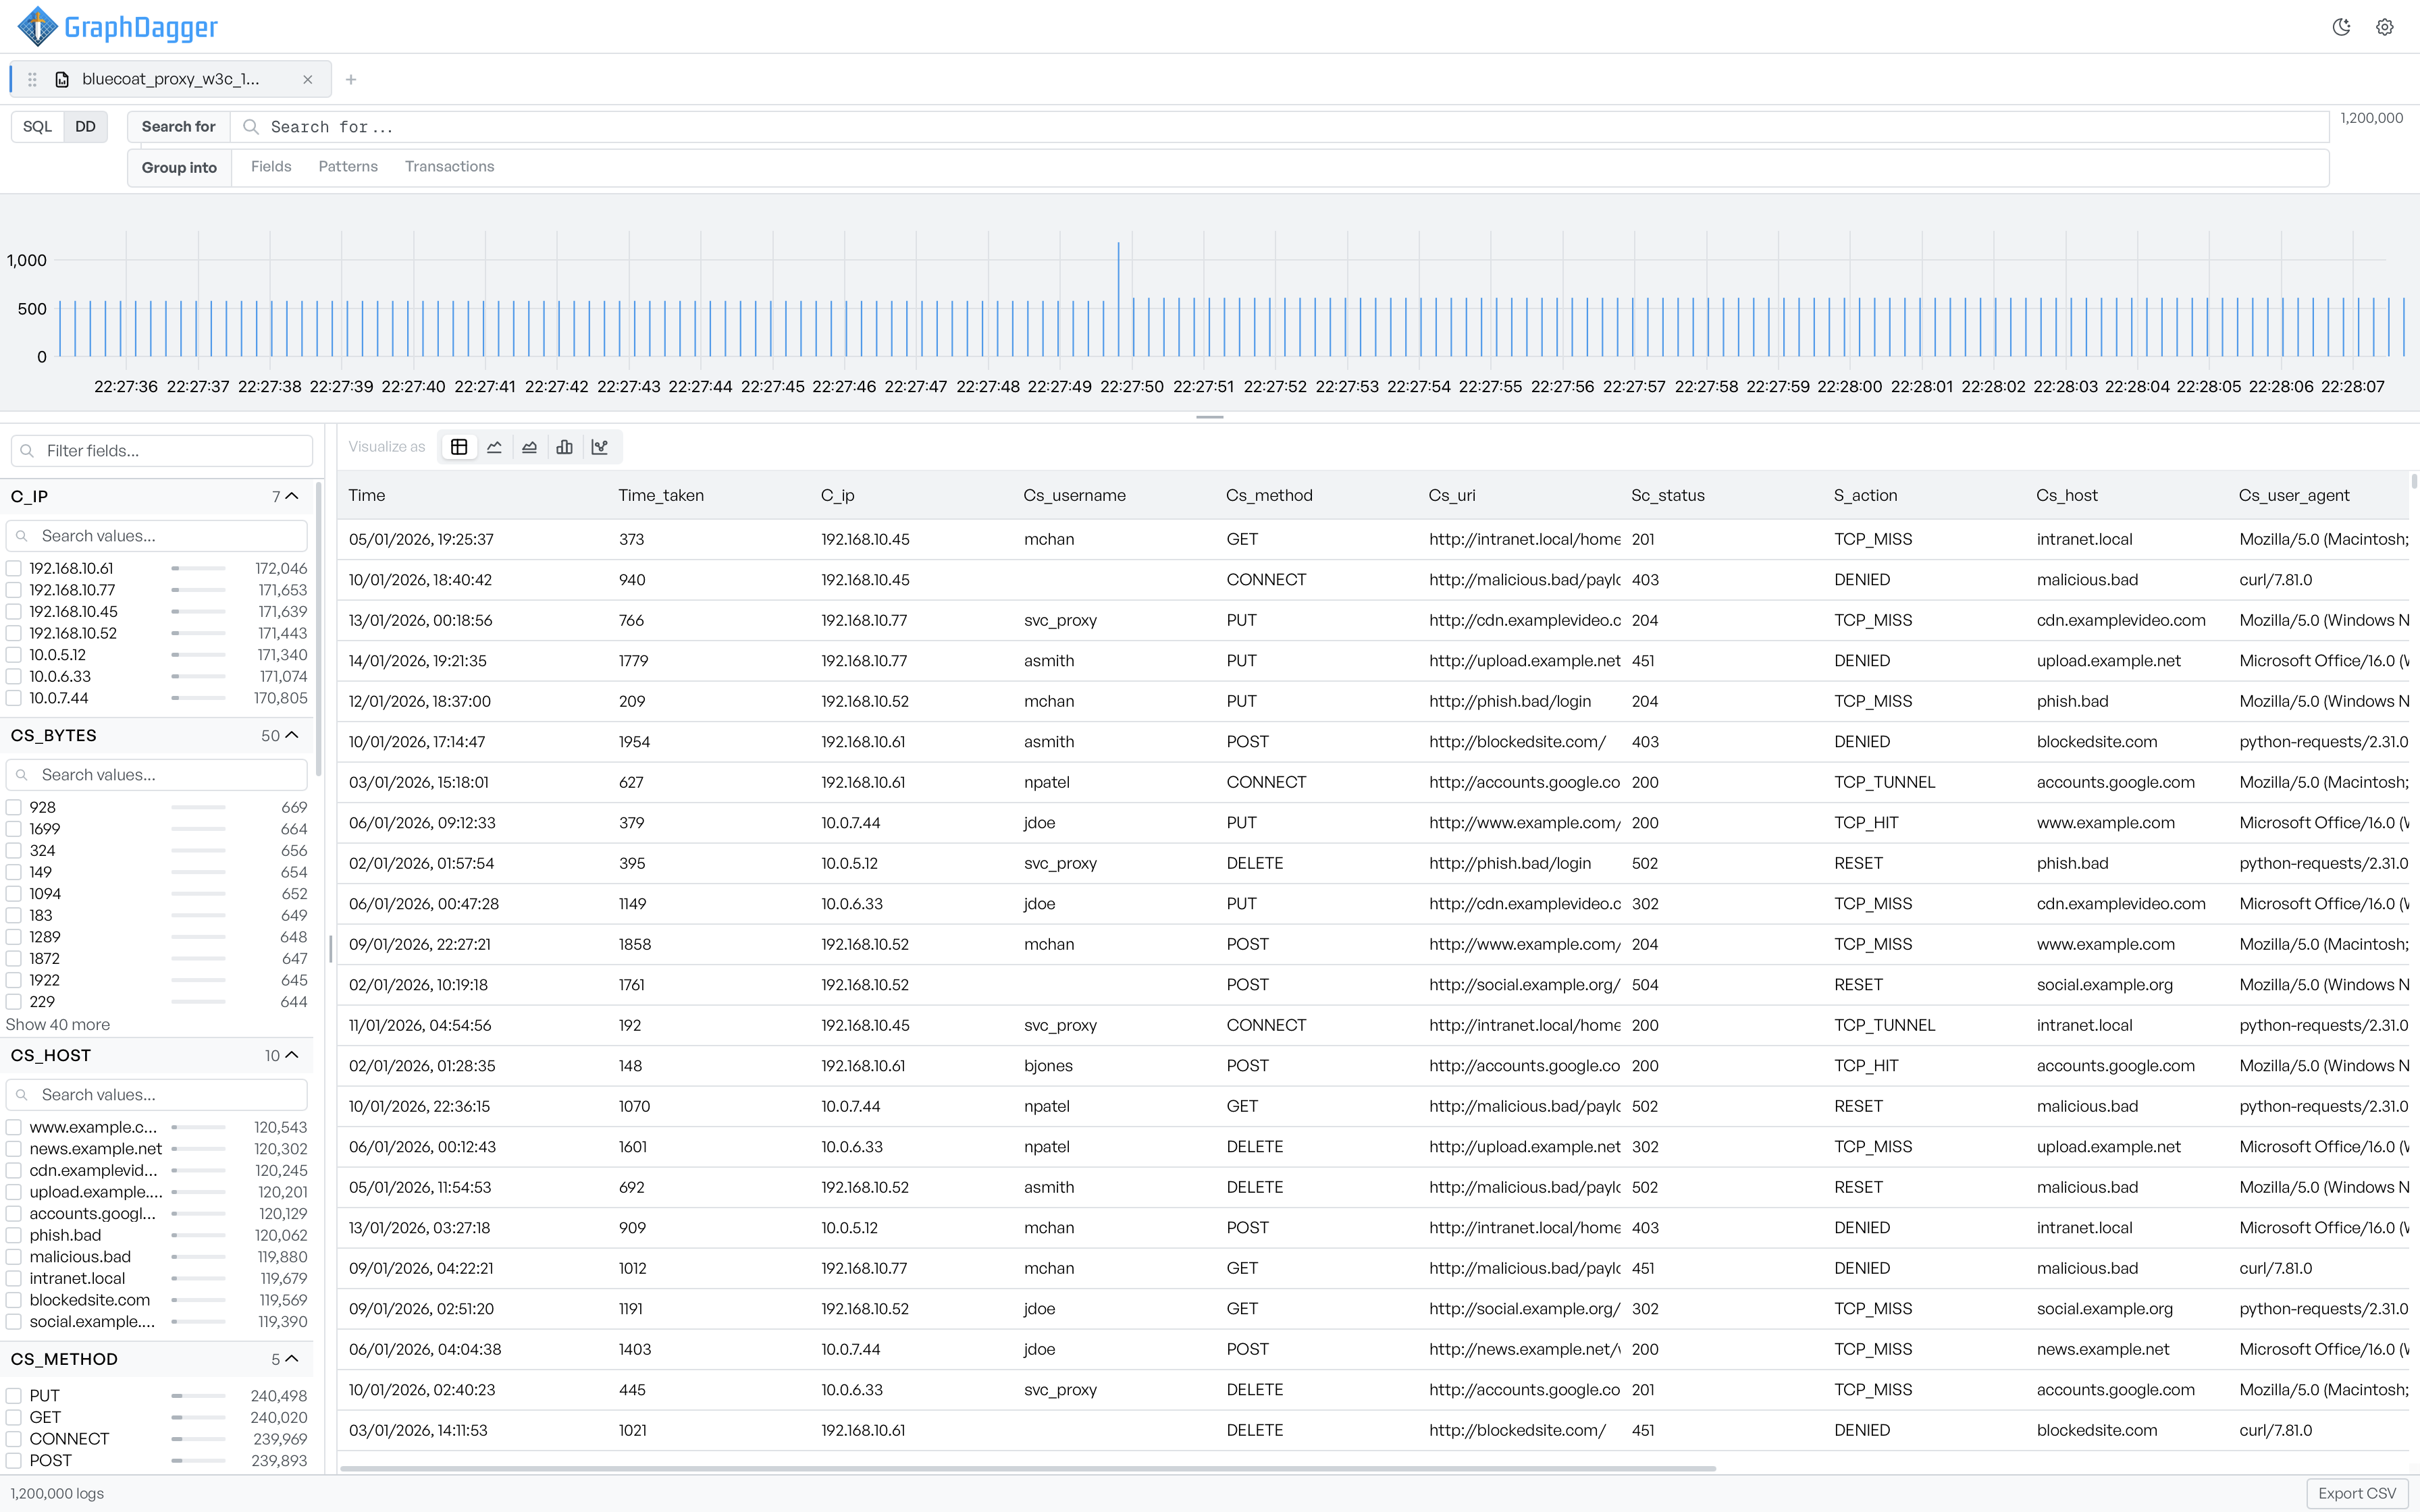
After a file loads, all four regions of the workspace respond to the current query.
Query bar#
The query bar controls what the rest of the view shows.
- SQL and DD toggles on the far left switch between query languages. SQL gives you a full query language. DD is the structured field-based search that Log Explorer uses by default.
- Search for is where you type field filters such as
c_ip:192.168.10.61. See Searching and filtering for the full syntax. - Group into has three modes that change how Log Explorer organizes the rows below: Fields, Patterns, and Transactions. See Grouping and visualizing, Patterns, and Transactions.
- The count on the far right shows filtered / total. For example, the count shows
172,046 / 1,200,000when a query narrows the file from 1.2 million rows down to 172,046.
Activity histogram#
The activity histogram plots event volume against a time axis. The bars update live as you change the query, so you can see the shape of activity for any slice of the file.
Facets panel#
The left panel lists every parsed field from the log. Each field expands to show the distinct values it contains with their row counts.
Use the facets to answer "what values does this field take?" without a query. Select a value to add it to the query.
Events table#
The events table shows one row per event with parsed columns from the log. The columns depend on the log format. Scroll horizontally to reach more columns.
Status bar#
The status bar shows the current result count and the active query language. Export CSV writes the current rows to a CSV file.
Where to go next#
- Searching and filtering: narrow the file with the query bar and the facets panel.
- Grouping and visualizing: aggregate by any field and render the result as a chart.
- Patterns: extract repeating log templates with LogMine or Grok.
- Transactions: roll up events into per-key transactions with duration and first-seen and last-seen timestamps.