What the network graph shows#
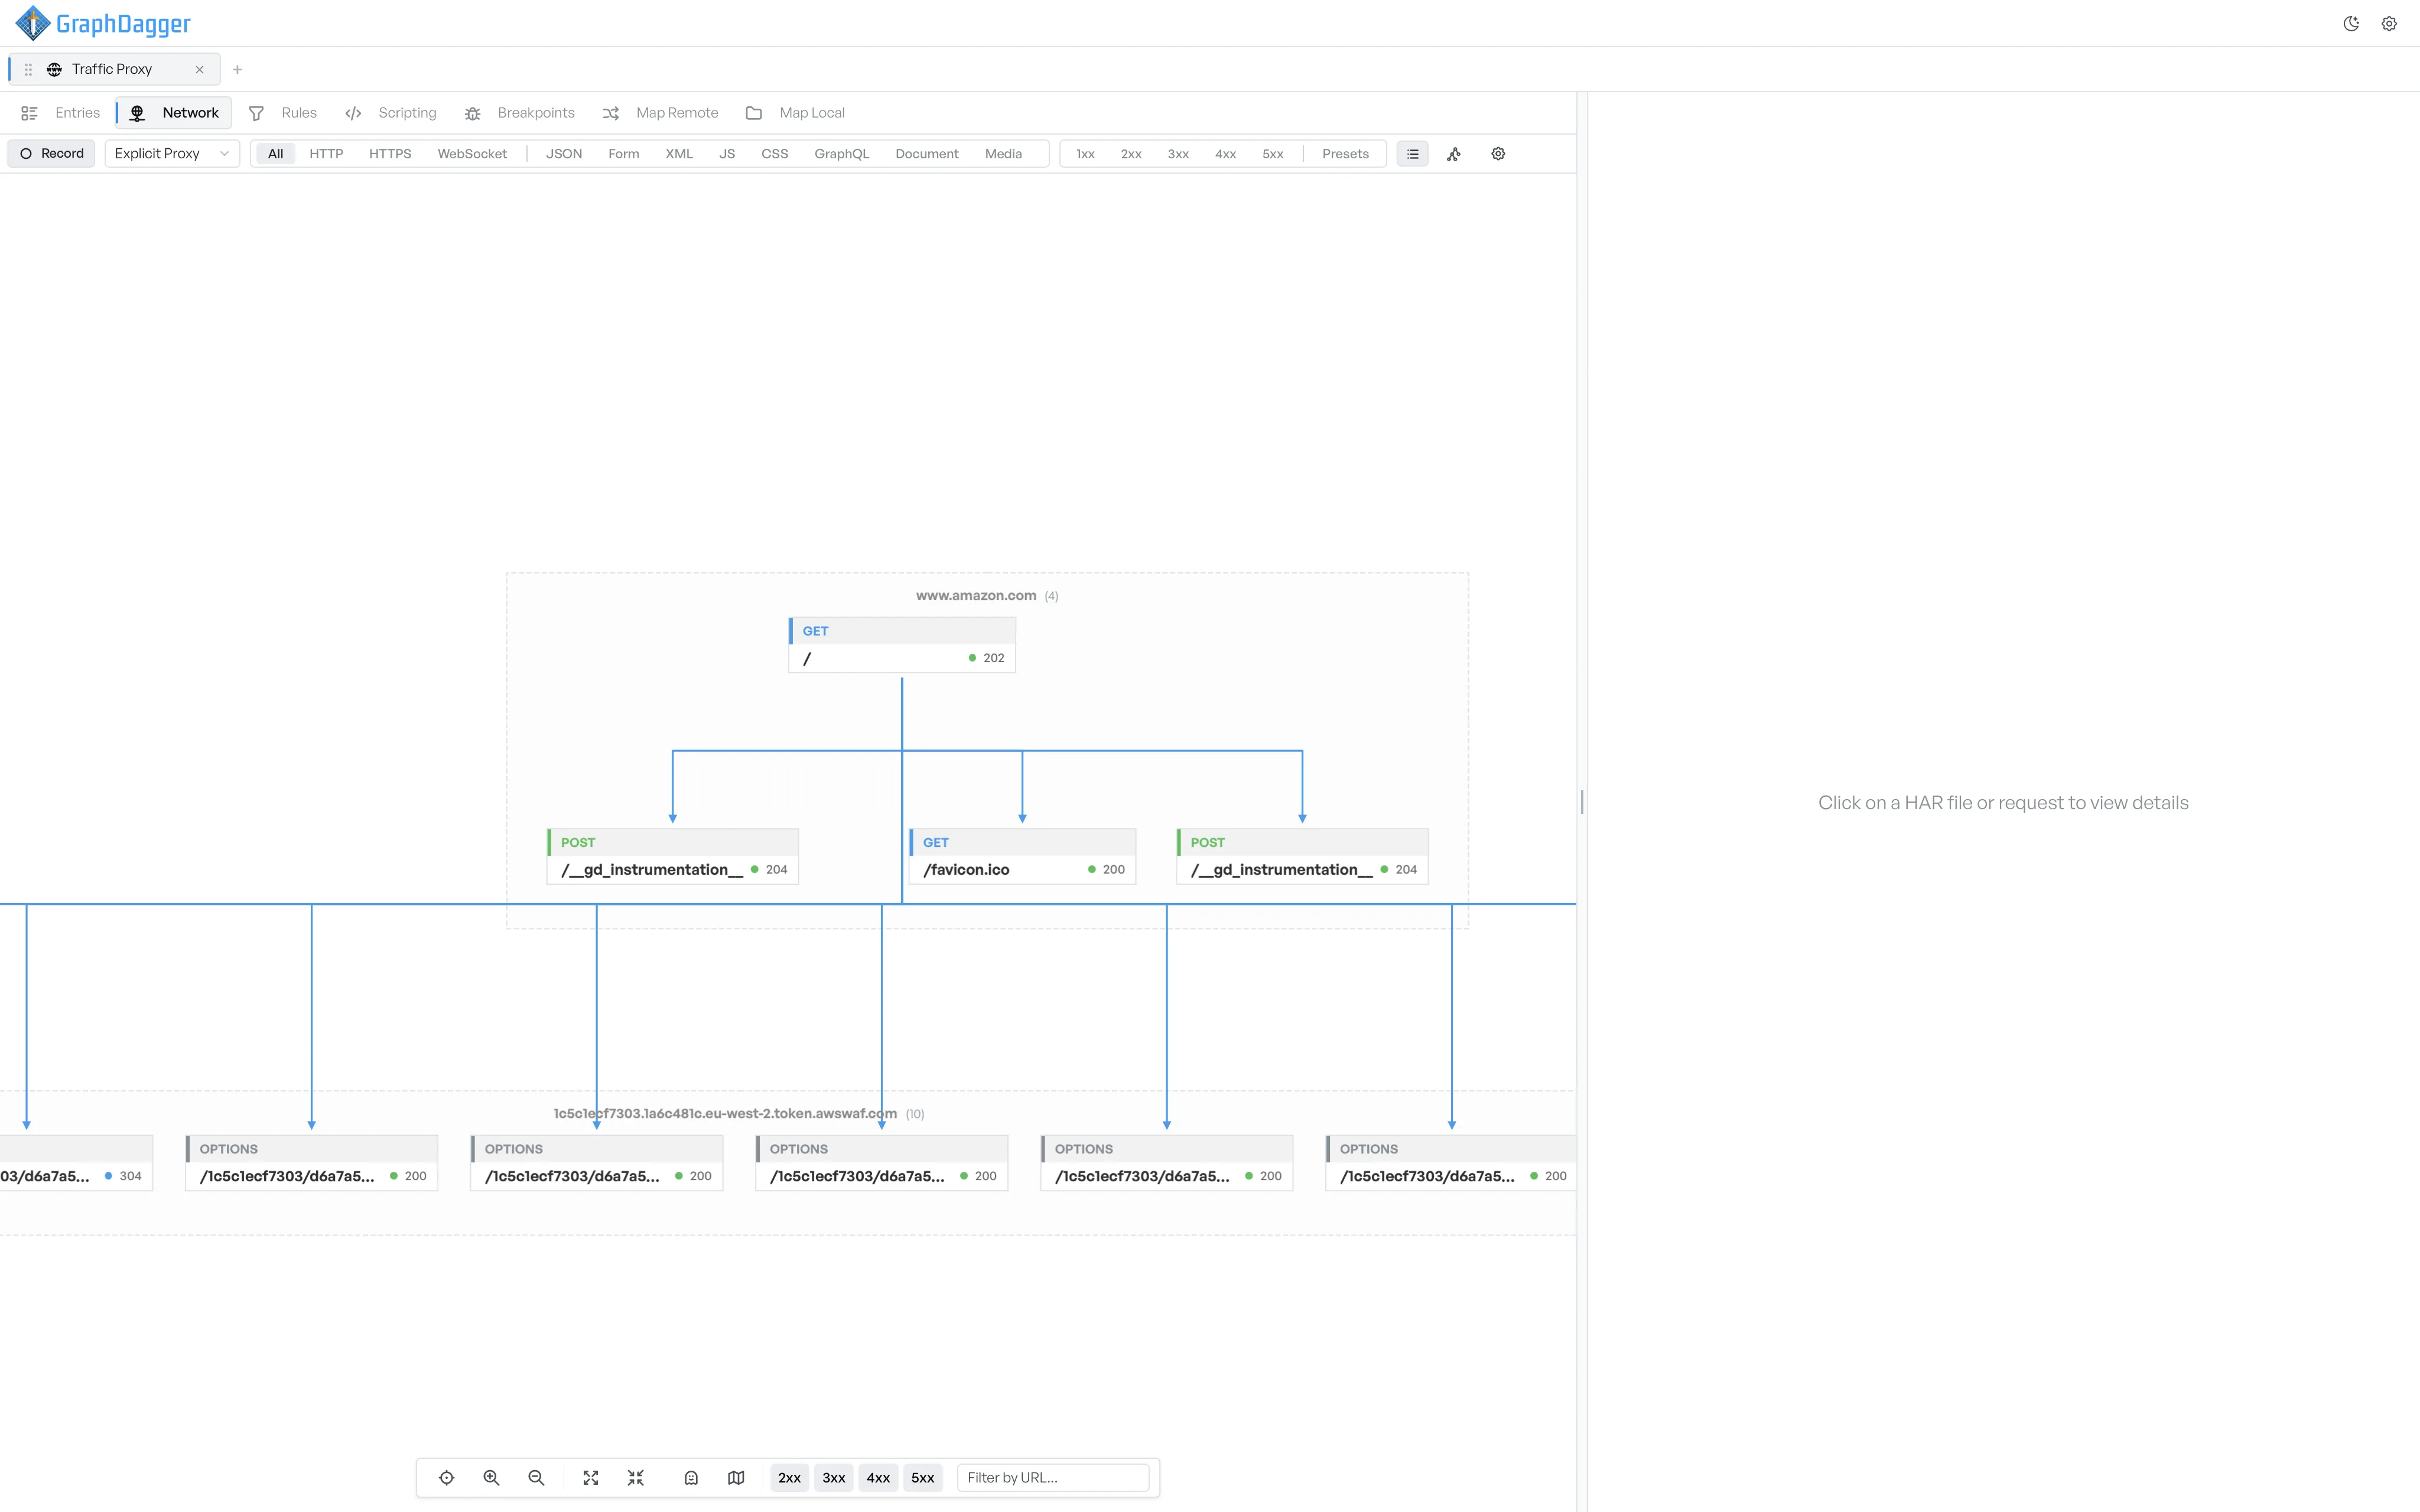
The Network sub-tab draws each host as a container and each request as a box, with arrows for the requests that kicked off other requests.
The Network sub-tab turns the entries list into a tree that shows what kicked off what. A page becomes the root of a small tree of scripts, stylesheets, fonts, and API calls. An API call becomes the root of any redirects it generated. An orphan sits on its own. It tells you that something arrived in the session with no traceable cause.
What the boxes and arrows mean#
The graph groups requests by host. Each request is a box labelled with its method, path, and status. Arrows connect requests that chained to each other across hosts.
A request box also shows its resource type icon (document, script, image, xhr, and so on), its duration, and its response size. You can therefore find heavy or slow nodes without opening each one.
Confirmed and heuristic edges#
GraphDagger colours each edge by the kind of evidence it has for the link.
- Confirmed edges come from a strong signal: a marker injected by the proxy, the browser's initiator metadata, the
Refererheader, or a 3xx redirect target. - Heuristic edges come from weaker signals: a same-domain page that started shortly before the child, or a temporal cluster on the same host.
A heuristic link is a best guess. If it looks wrong, it usually is. The colour tells you at a glance which links are evidence and which are inferred.
Pan, zoom, and filter the graph#
The graph toolbar gives you pan and zoom, fit-to-view, and collapse-all. It also has the same status-class chip filters as the entries list, and a URL filter input. Use them to narrow the graph to part of the session.
Open a node in the inspector#
Select a request node to open that request in the inspector. The result is the same as when you select its row in the entries list.
Where to go next#
For the algorithm that decides which arrows are drawn and why, see How the network graph works.