What the response panel shows#
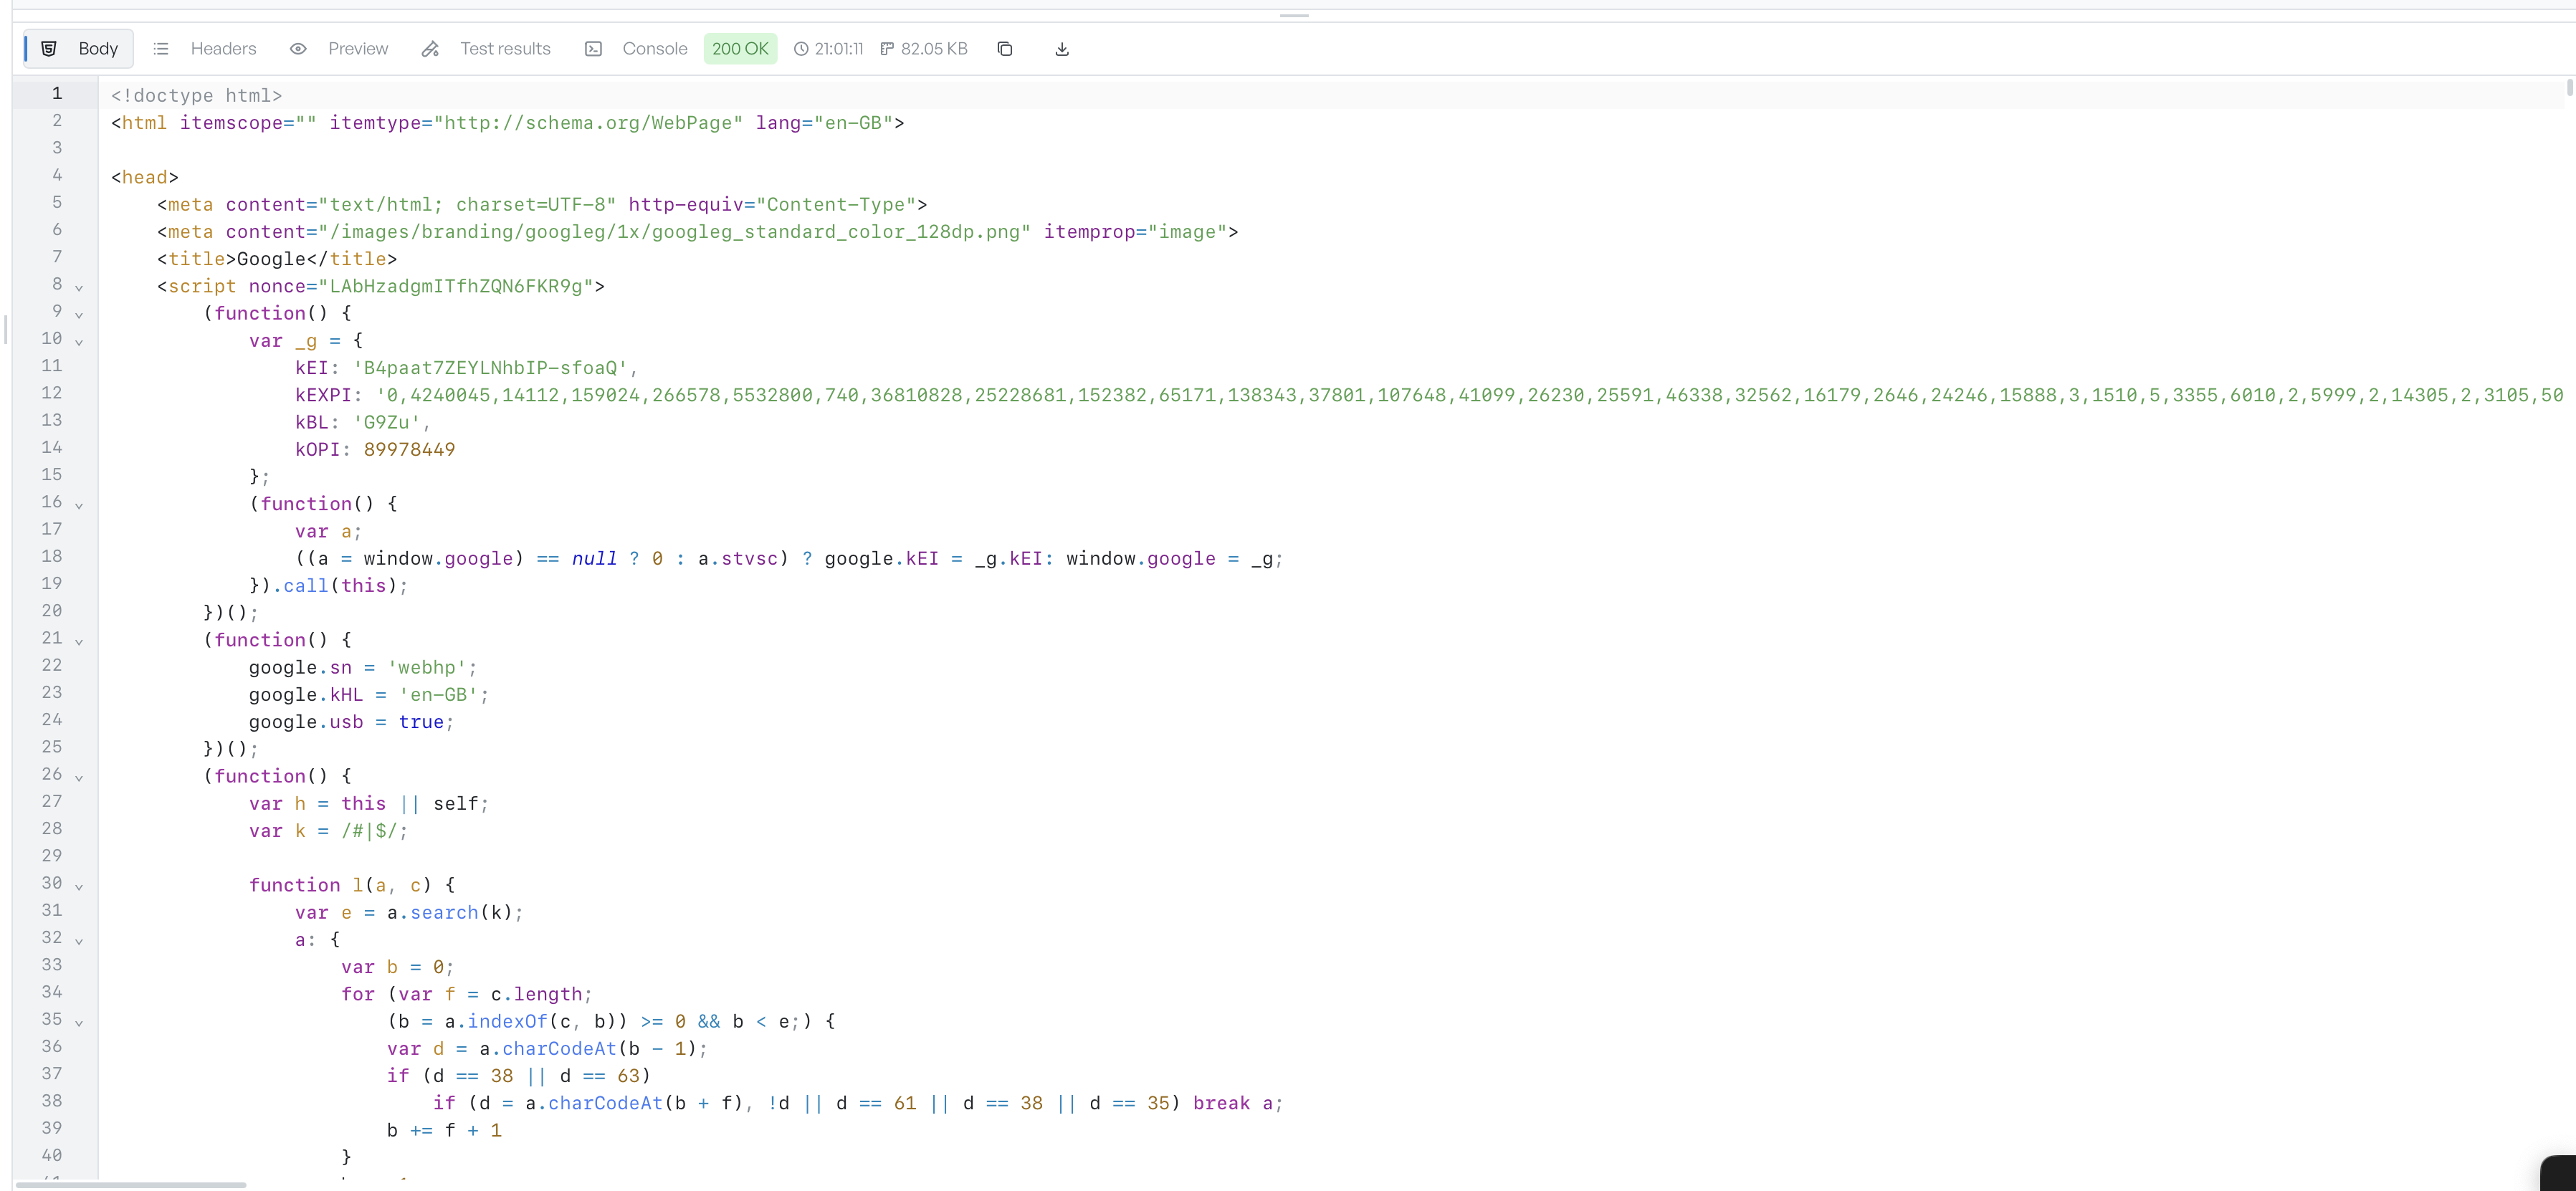
A header row reports status, time, and size, and five tabs hold the detail.
The response panel fills the lower half of every request tab. When a request finishes, it shows what the server sent back across five tabs, with a header row that reports the outcome at a glance. This page covers that row and links to each tab.
The header row#
The row across the top of the panel summarises the response. It shows:
- A coloured status badge with the status code and reason phrase, such as "200 OK". The colour follows the status class: green for 2xx, blue for 3xx, orange for 4xx, and red for 5xx.
- The time the response arrived, shown in your local format next to a clock icon.
- The response size next to a ruler icon, scaled to bytes, kilobytes, or megabytes.
- A copy button that copies the response body to the clipboard. It copies JSON pretty-printed. The panel hides this button for binary responses.
- A save to file button that downloads the response to disk.
The five tabs#
- Body shows the response body with syntax highlighting, or an inline preview when the body is binary.
- Headers lists every response header in a two-column grid.
- Preview renders an HTML body. It is enabled only for HTML responses.
- Test results shows the pass or fail list from a test script. When a test has run, the tab label carries a count, such as "Test results (1/1)".
- Console shows log lines from your scripts. It is enabled only when a script logged something.
Before a response arrives#
While a request is in flight, the panel reads "Sending request...". Before you have sent anything, it reads "No response yet". If the request fails, the panel shows the error message in its place.