Sort, filter, and edit features#
Read the active layer as a spreadsheet, narrow it with column filters, edit values in place, and keep the selection in step with the map.
The attribute table shows the active layer as a spreadsheet: one row per feature, one column per property. You can sort, filter, and edit it. It sits under the map and opens from the table button in the map controls. Before you load a layer, it reads 'Import a layer to see attributes'.
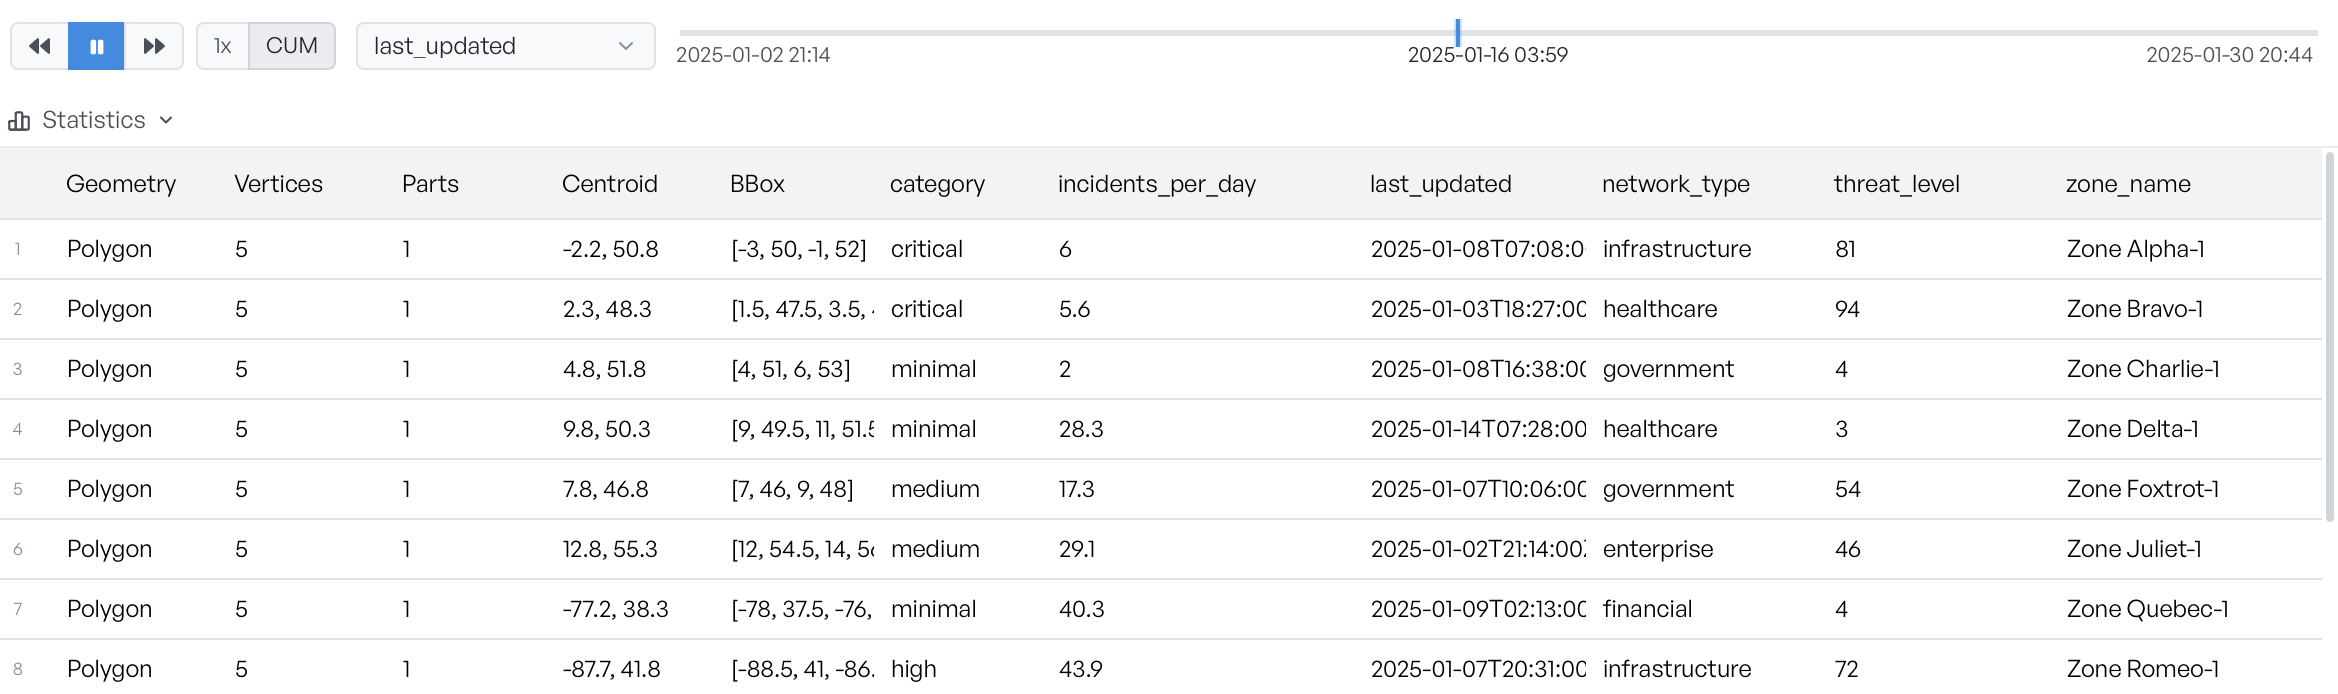
Geometry and property columns#
Five columns come first: Geometry, Vertices, Parts, Centroid, and BBox. GraphDagger derives them from each feature's shape rather than from its data. Your own properties follow, in alphabetical order. The table right-aligns numbers and left-aligns everything else. To resize a column, drag its edge.
Centroid and BBox are there to read, not to work with. You cannot sort or filter either one. The centroid is a plain average of the feature's positions rather than a true area-weighted centre, so treat it as a rough locator.
Sort and filter columns#
Click a header to sort by it. Click again to reverse the order, and click a third time to clear the sort. An arrow on the header shows the direction. Empty values always sort to the bottom, whichever direction you choose.
Property columns also carry a filter menu, and the menu adapts to the content of the column. Every column offers a text filter with modes Contains, Does not contain, Equals, Does not equal, Starts with, Ends with, Is empty, and Is not empty. Underneath, a property filter changes shape with the data: a range slider for numbers, a checklist of values for categories, and a text box for anything else. The filter applies as you type, and Clear all resets that column.
Filters on different columns combine, so a feature must satisfy all of them to stay visible. When you switch to another layer, the sort and the filters both reset, and so do any uncommitted edits.
Edit a cell value#
You can edit cells in place. GraphDagger holds an edit until you commit it. On commit, it stores anything that reads as a number as a number, and everything else as text. You cannot edit the five geometry columns, because GraphDagger calculates them from the shape rather than stores them on it.
Selection follows the map#
Click a row to select that feature, and the map flies to it. Ctrl+click, or Cmd+click on macOS, adds rows to a selection without a move of the map. Press Enter on a focused cell for the same result as a click on the row. The link runs the other way too: when you select a feature on the map, the table highlights its row and scrolls it into the middle.
Why a row is missing#
Filters stack in a fixed order: first the timeline, then any spatial query, then the property filter, then the column filters, then the sort. If a row you expect is missing, work back through that list.
While a spatial query is live, a bar above the table reports how many features it matched out of the layer total, with a percentage. The bar also summarises up to three numeric properties across the matches, and offers a Clear button.