What Geo Map plots#
See what the map does with a file of features, and how the five regions of the workspace fit together.
Geo Map draws geographic data on an interactive map, so you can see where things are and interrogate what they are. Point it at a file of features. It plots them, colours them by their own attribute values, and lets you select any one to read its properties, measure it, or step through it in time.
Open Spotlight and select Geo Map from the Workbench group, or click the Geo Map tile anywhere it appears in the app. The feature opens inside its own workspace tab.
Everything is a layer#
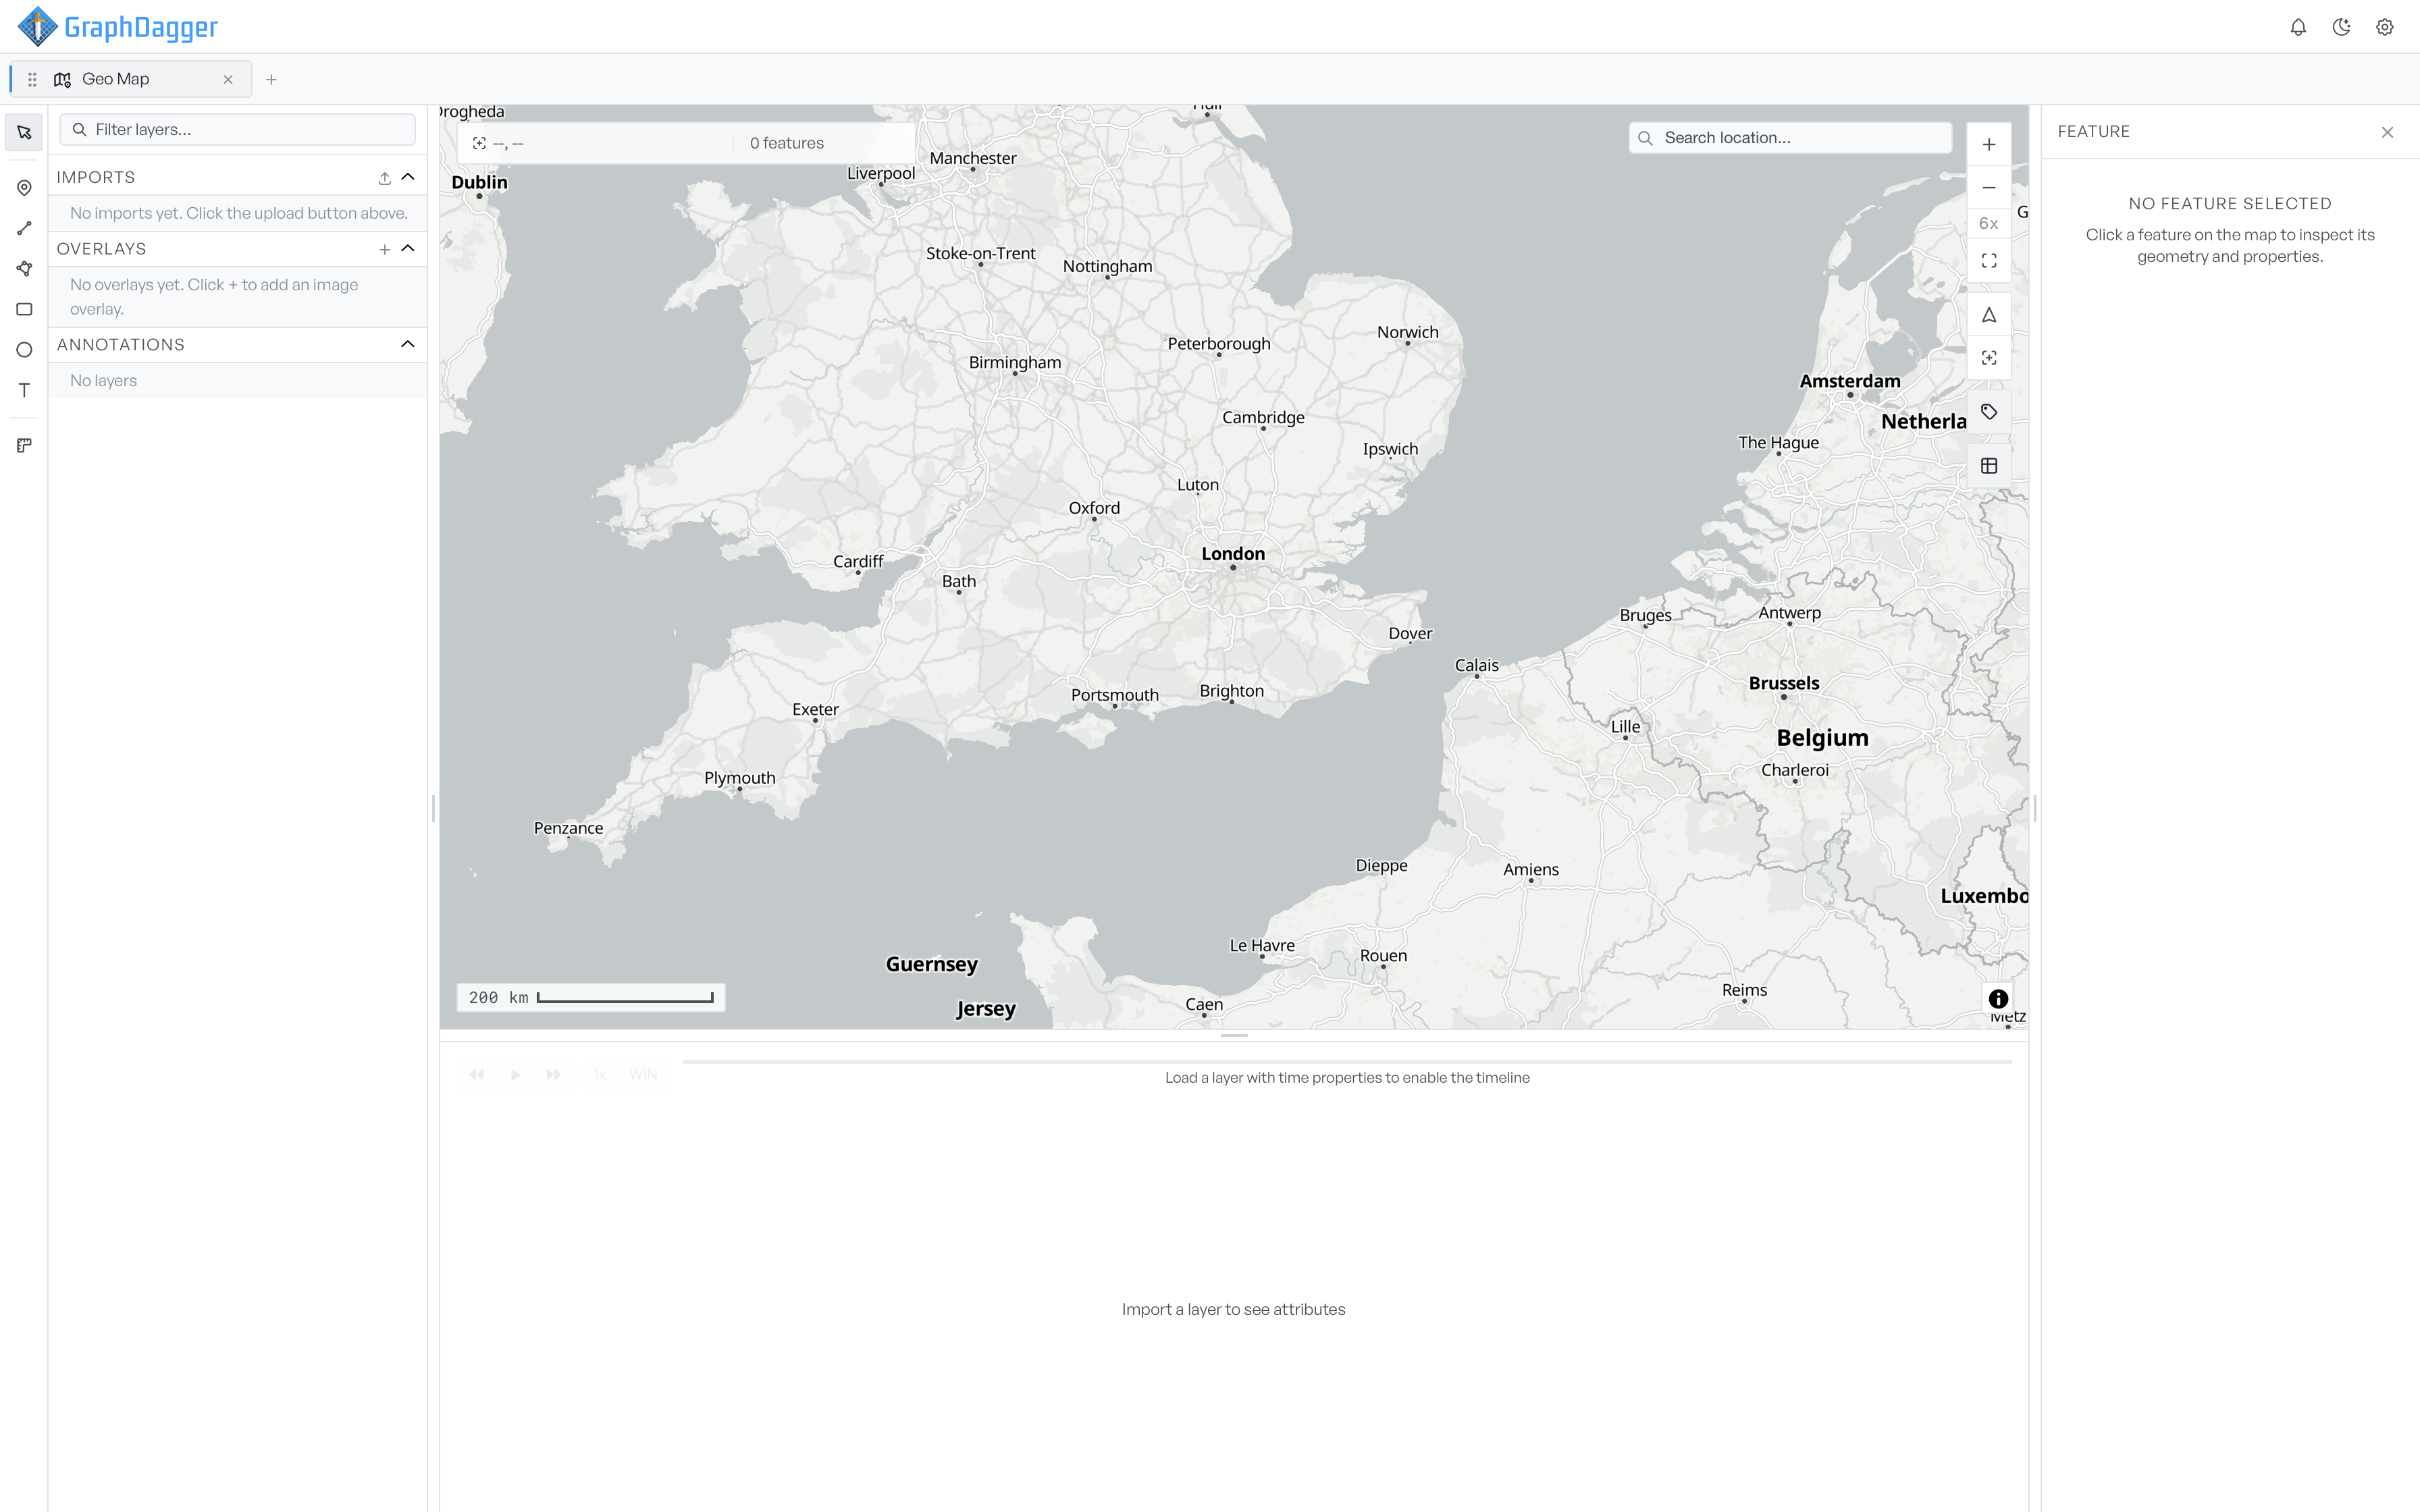
One idea carries the whole workspace: a layer. A file you import becomes a layer. An image you pin to the map becomes a layer. A shape you draw and a distance you measure each become a layer too. The Layers panel down the left lists everything currently on the map. Whatever you select there, or on the map itself, decides what the inspector on the right shows you.
That is why the Layers panel splits into three sections rather than one flat list.
- Imports: the data you brought in from files.
- Overlays: the images you pinned.
- Annotations: the shapes, labels, and measurements you drew yourself.
See Layers for what each row can do.
The shape of the workspace#
The tool palette picks what a click on the map does: select, draw, or measure. The Layers panel lists your layers and, when you expand one, holds its styling controls.
To resize the Layers panel, the attribute table, or the inspector, drag its divider. All three collapse if you drag far enough. The attribute table also has its own toggle in the map controls, and the inspector has a close button in its header.
The inspector is context-sensitive. Its header reads Feature, Measurement, Image overlay, or Text annotation depending on what you selected, and the body changes to match.
What sits around the map#
Navigating the map covers the status strip, the scale bar, the location search box, and the map controls.
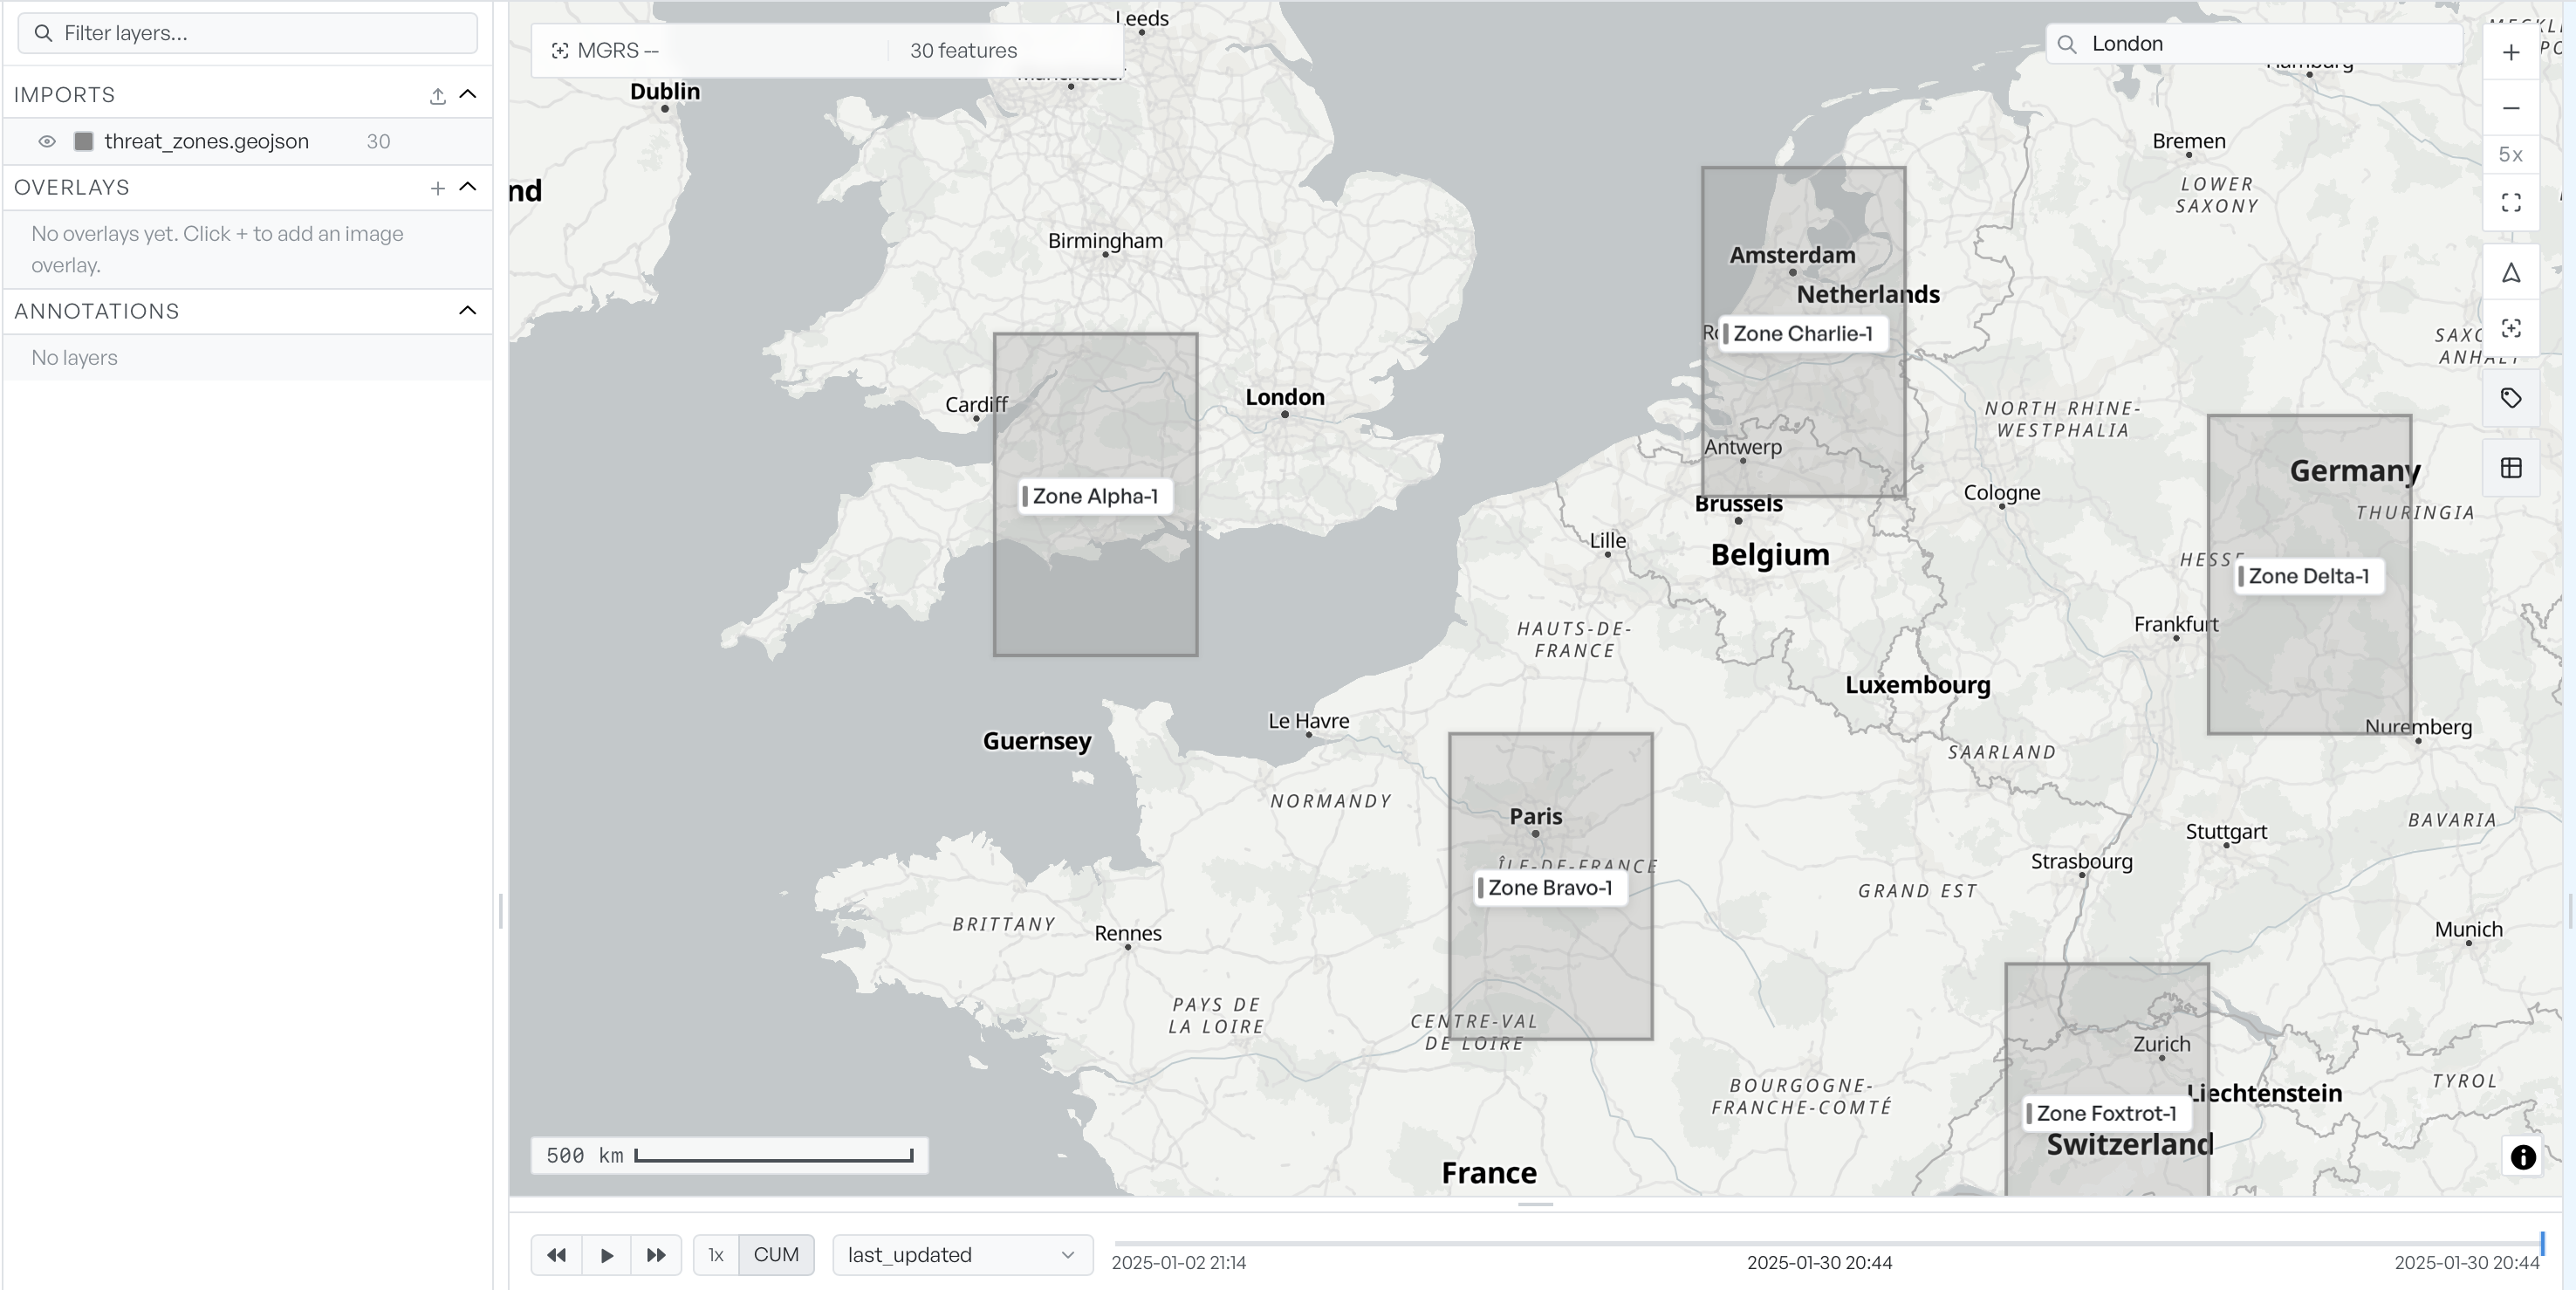
Once you load a layer, the map fills out and the panels come alive. The attribute table lists every feature, and the timeline at the bottom of the map wakes up if the data carries timestamps.
Where to go next#
Start with Importing data to get a file onto the map. Once something is plotted, Colour styling and Render modes change how it reads, and the Attribute table is where you sort and filter it.