Colour features by value#
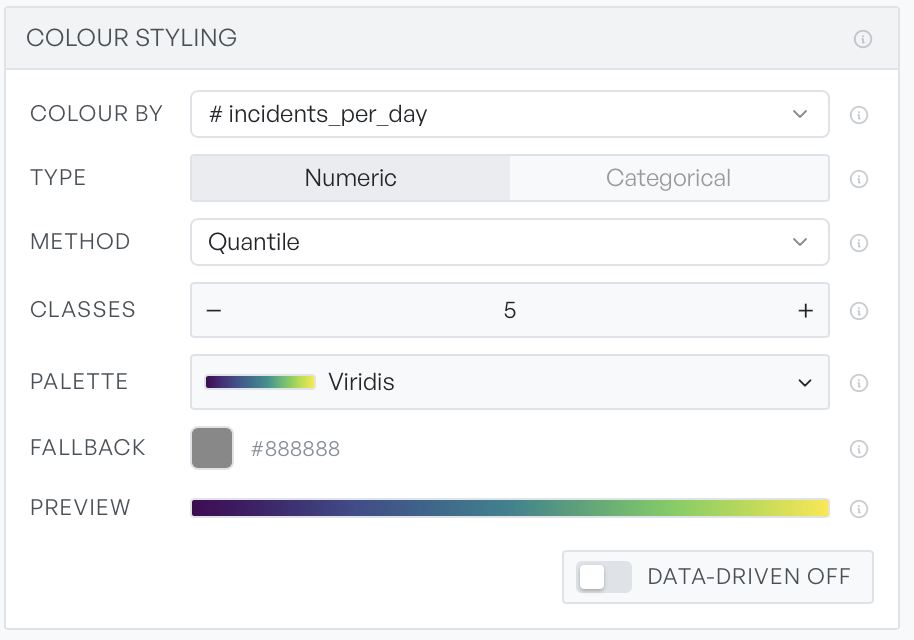
Drive each feature's colour from one of its properties, and set the classification method, the class count, and the palette.
A layer starts as one solid colour. Colour styling replaces that with a colour drawn from the data. Pick a property, and Geo Map colours every feature by its own value for that property. A layer of zones becomes a map of how bad each zone is, and you touch no single feature to get it.
Colour styling is off until you turn it on. Expand the layer to show the controls. The switch at the foot of the card reads Data-driven off until you flip it. After that, every change you make applies live.
Numeric or categorical#
Colour by chooses the property. Each entry in that list carries its type, so you know what you get: a hash for numbers, an A for text categories, a dot for properties that are mostly empty, and a question mark for mixed ones. The list shows mostly-empty properties, but you cannot choose them.
Type then decides how those values become colours. The right answer usually follows from the property you picked.
Numeric sorts the values and cuts them into ordered bands, so the result reads as a graduated scale from low to high. Categorical gives every distinct value its own colour. That suits a status or a category name, where there is no order to respect.
Choose the class bands#
Numeric styling adds two more controls. Method decides where the cuts fall:
| Method | Where the boundaries go |
|---|---|
| Quantile | Each band holds the same number of features |
| Equal interval | Each band covers the same width of values |
| Natural breaks (Jenks) | Boundaries follow the natural gaps in the distribution |
Quantile guarantees that Geo Map uses every colour, which is what you usually want. Equal interval is truer to the raw numbers, but it can leave bands empty when the data is skewed. Natural breaks tends to look best on real data, because it cuts where the data itself is already grouped.
Classes sets how many bands there are, between 3 and 9, and starts at 5. More bands show finer gradients. Fewer bands are easier to read at a glance.
Palettes and the fallback#
Palette picks the colour ramp, and the list follows the type you chose.
- Numeric: Viridis, Blues, Oranges, Greens, Reds, Plasma, and Inferno. Starts on Viridis.
- Categorical: Category 10, Pastel, and Set 2. Starts on Category 10.
Preview shows the result as a gradient or as a row of swatches before you commit to it.
Fallback is the colour for features that fall outside all of it: a missing value, or a value outside the classified range. Leave it a neutral grey. That choice makes gaps in your data visible rather than hides them inside the ramp.
When it will not classify#
Two properties cannot be classified, and the card tells you so rather than colours the layer wrongly. A numeric column with fewer than two distinct values has nothing to split. A column with no usable values at all has nothing to work with. Pick a different property, or check that the import brought the values through as numbers.
Categorical styling colours at most 24 distinct values. The legend on the map lists the first 12 and summarises the rest as a count.