Read live server sessions#
Find the query holding up a shared server, see which statements cost the most, and end a session that is stuck.
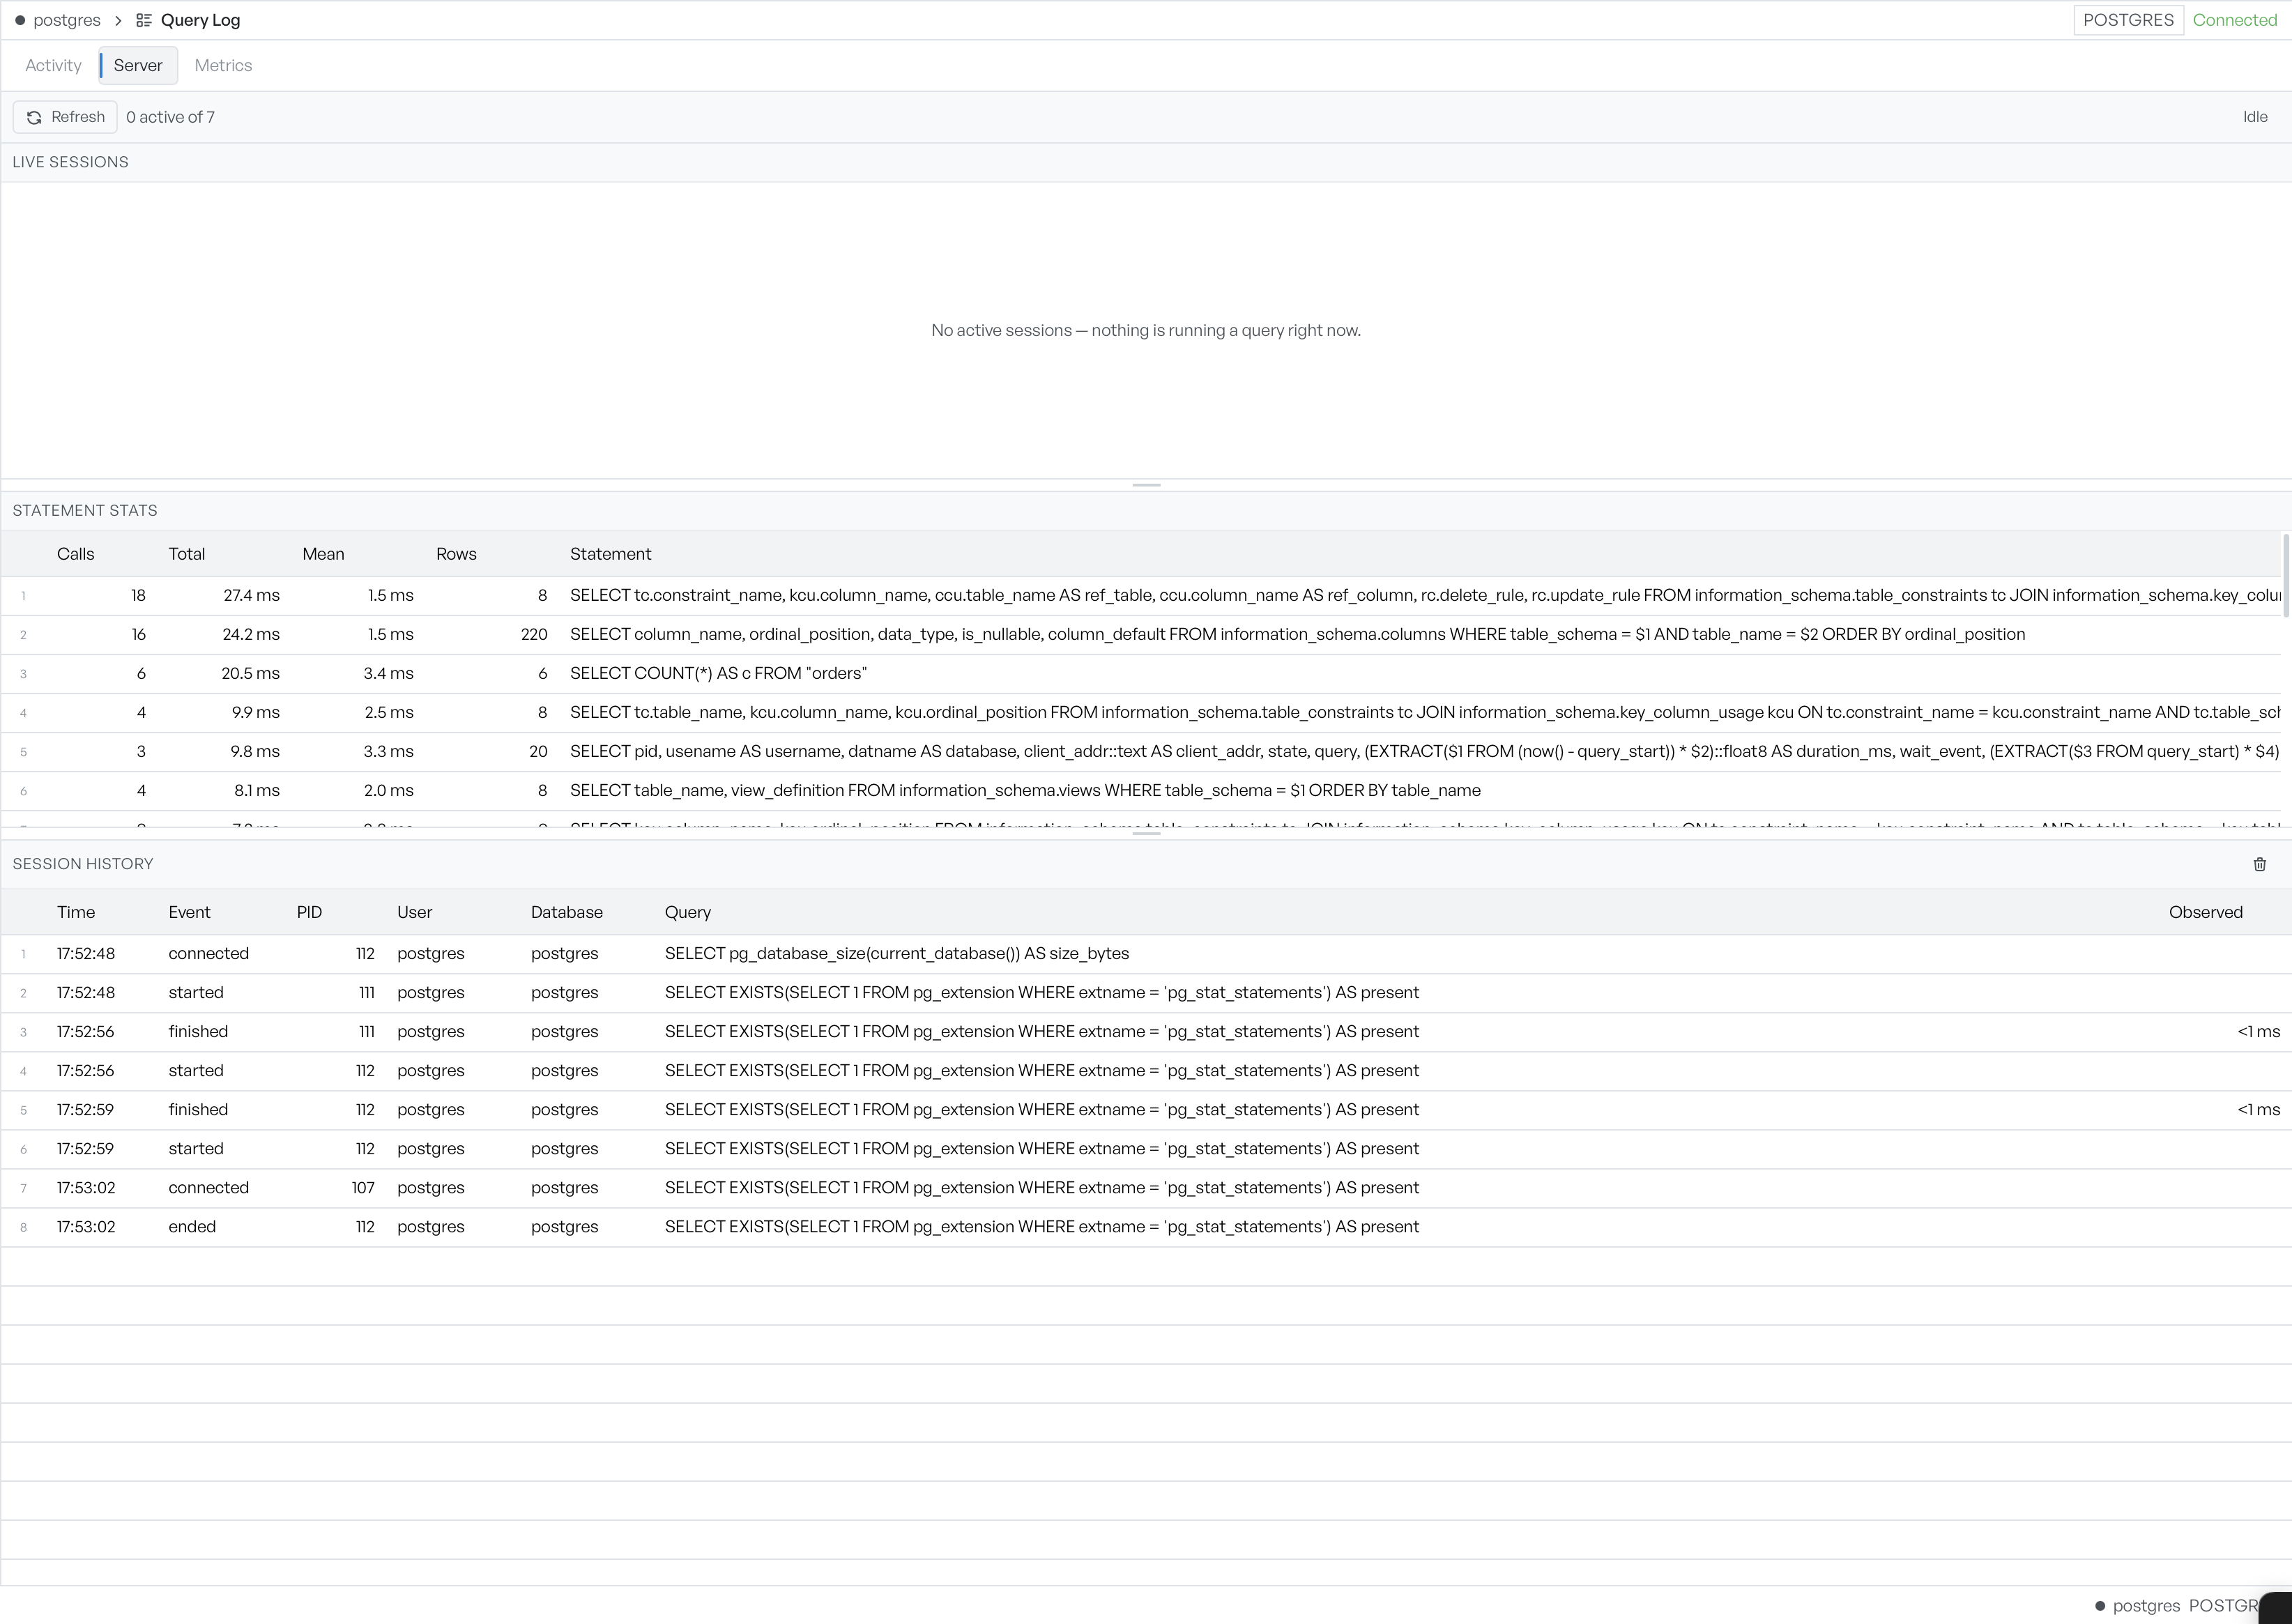
The Server sub-view shows what a whole database server is doing, not only your own connection. It is where you look when a server feels slow. You find the query that holds things up, see which statements run most often, and follow the sessions as they come and go. The sub-view is available for PostgreSQL, MySQL, and SQL Server.
The view refreshes every few seconds while it is open, and only while it is open. If a refresh fails, the view pauses and shows the error once. Select Refresh to try again and clear the pause.
Read the Live sessions list#
Live sessions lists the sessions connected to the server. By default it shows only the active ones, those that actually run a query, with a count such as "1 active of 7". The Idle toggle brings the resting sessions into view as well.

From a session you can act on a query that is stuck: cancel the running statement, or end the session outright. Use these with care on a shared server, since they interrupt whoever owns the session.
Find the costliest statements#
Statement stats aggregates the server's statements. It shows how many times each has run (Calls), the total and mean time it has taken, the rows it returned, and the statement text. Sort by total or mean time to surface the queries that cost the server the most.
Read the session event stream#
Session history streams session events as they happen. Each event shows the time, the event itself such as connected or finished, the process, the user, the database, and the query. The bin button clears the stream.