Read server health charts#
Sample a server every few seconds and watch its connections, cache hits, and throughput move over time.
The Metrics sub-view charts a server's health over time, so you can watch load build and settle instead of reading a single snapshot. It is available for PostgreSQL, MySQL, and SQL Server, and samples the server every few seconds while it is open.
Read the stat cards#
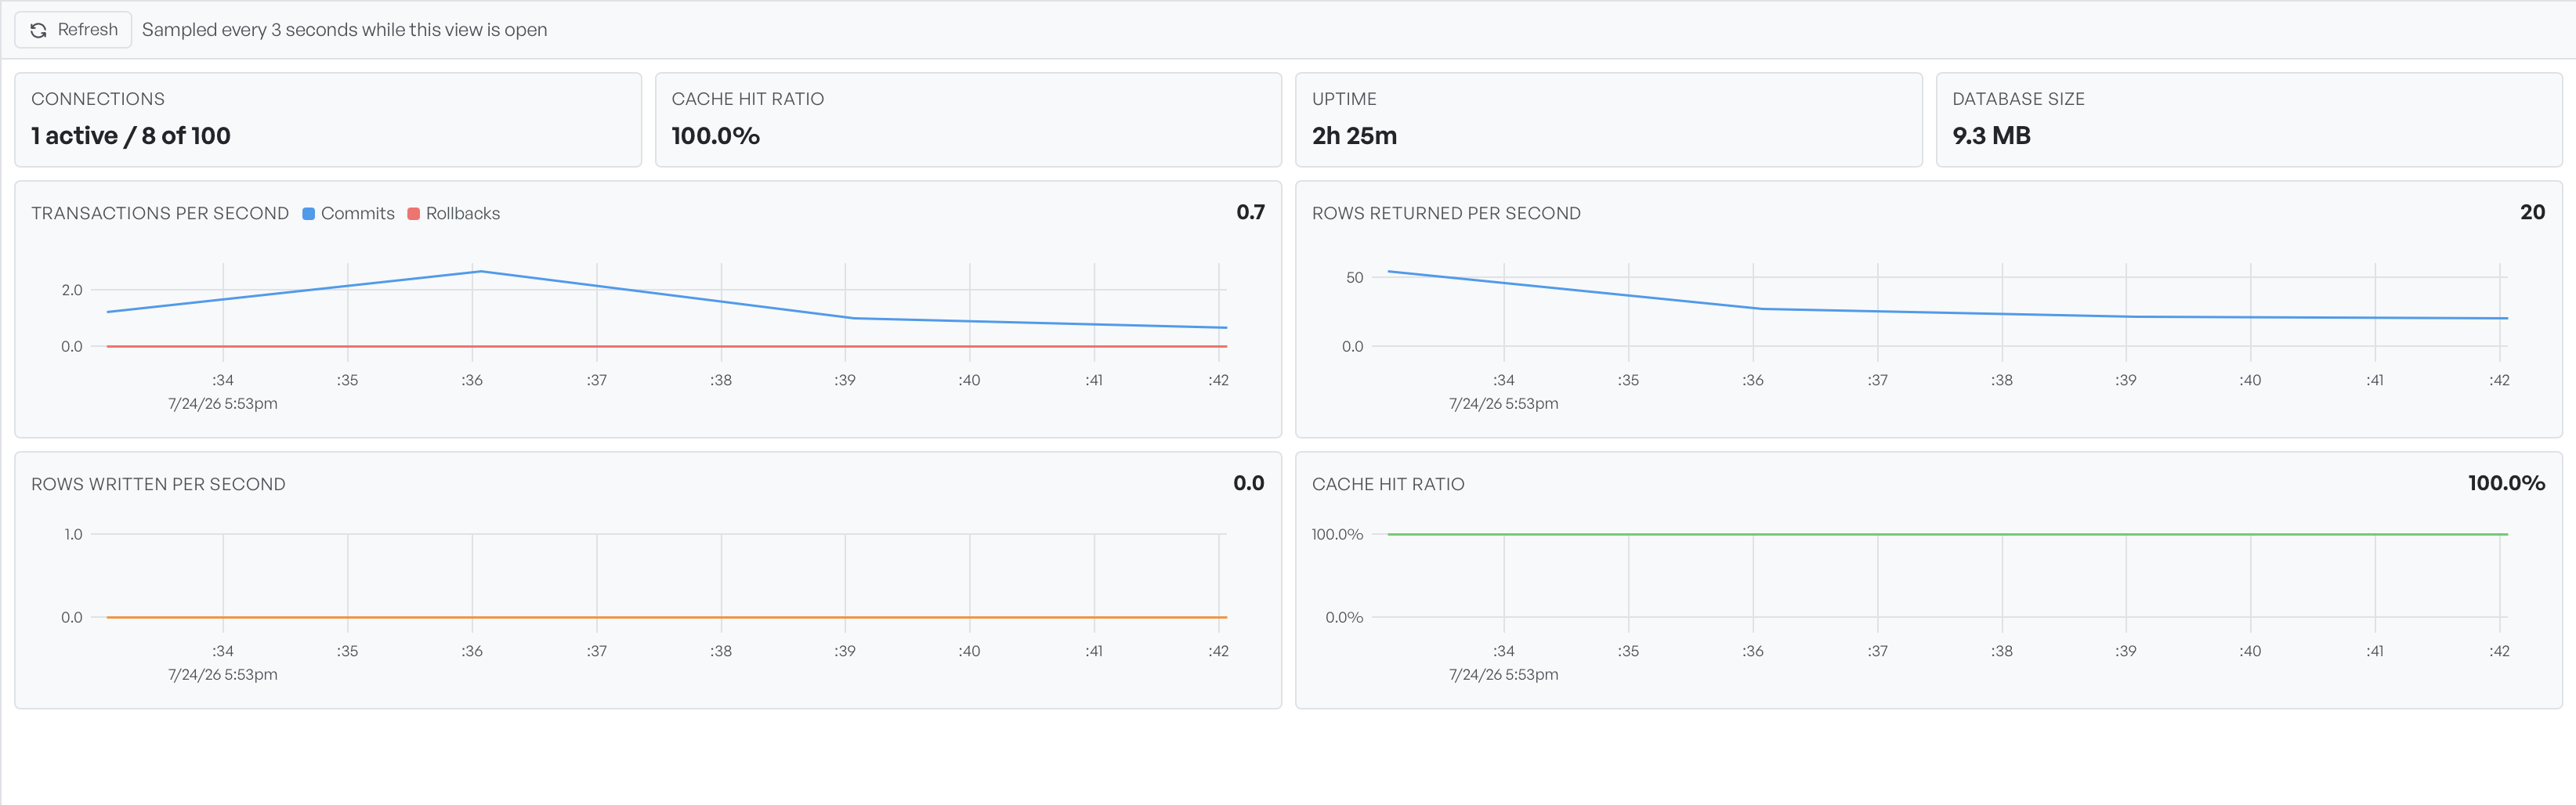
The cards give the server's current state: the number of connections and the limit, the cache hit ratio, how long the server has been up, and the size of the database.
Read the rate charts#
The charts track throughput as it changes. Database Client works out each figure from the server's own counters between samples. What the charts show fits the engine.
For PostgreSQL the charts cover transactions per second split into commits and rollbacks, rows returned per second, rows written per second, and the cache hit ratio. For MySQL they cover queries per second, rows read and written per second, and network bytes in and out.
Rates are the change between two samples, so the charts need a moment to appear. A short note tells you they are collecting, and the lines begin after the second sample.