Read the activity histogram#
Follow the dot markers for actions, events, and console messages, and select one to move the playhead to that moment.
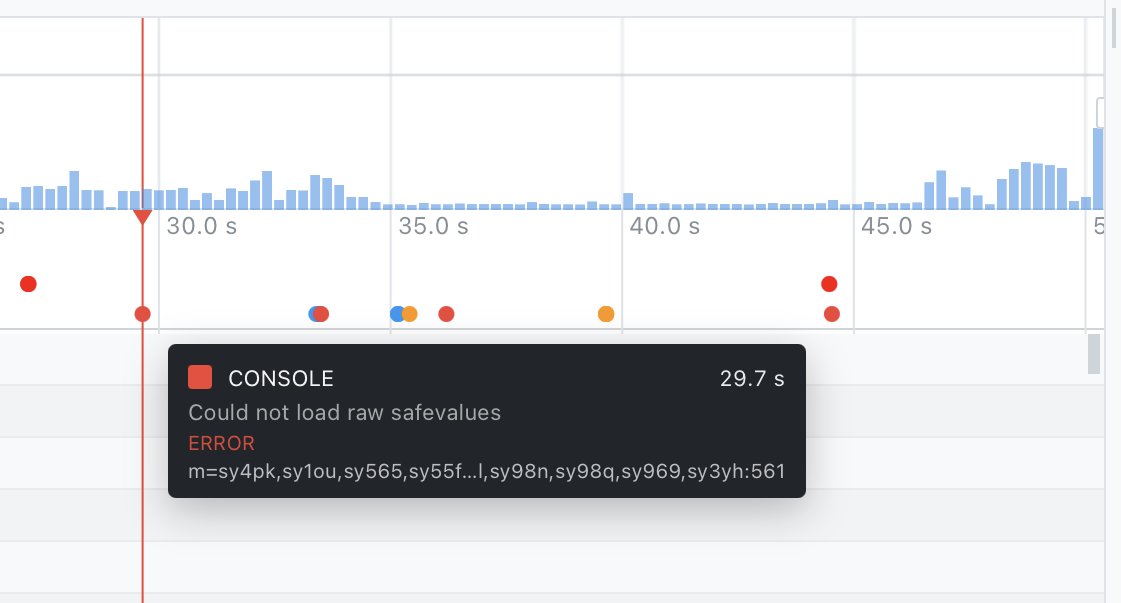
The activity markers are the top part of the timeline track. They show every action, event, and console message as a dot on its own row, so you can see at a glance when the run was busy and where things went wrong.
The three rows are actions, events, and console messages. The colour of a dot shows its kind, and errors stand out in red, so a cluster of red is usually where to look first.
Read a marker tooltip#
Hover a dot to see what it is: its type, the time it happened, and its text. A console dot also shows the level, such as error, and where the message came from.
Jump to a moment#
Select anywhere on the markers to move the playhead there. If you click close to a dot, the playhead snaps to that exact moment, so you can line the preview up with the action or the error you want. When you move the playhead this way, the selected action also updates, so the inspector follows.
The density plot on the timeline overview above summarises the same activity across the whole run. Use it to spot busy stretches before you zoom in.