Read the network waterfall#
See where each request spent its time across the phase segments of its bar, then open its full detail from the events list.
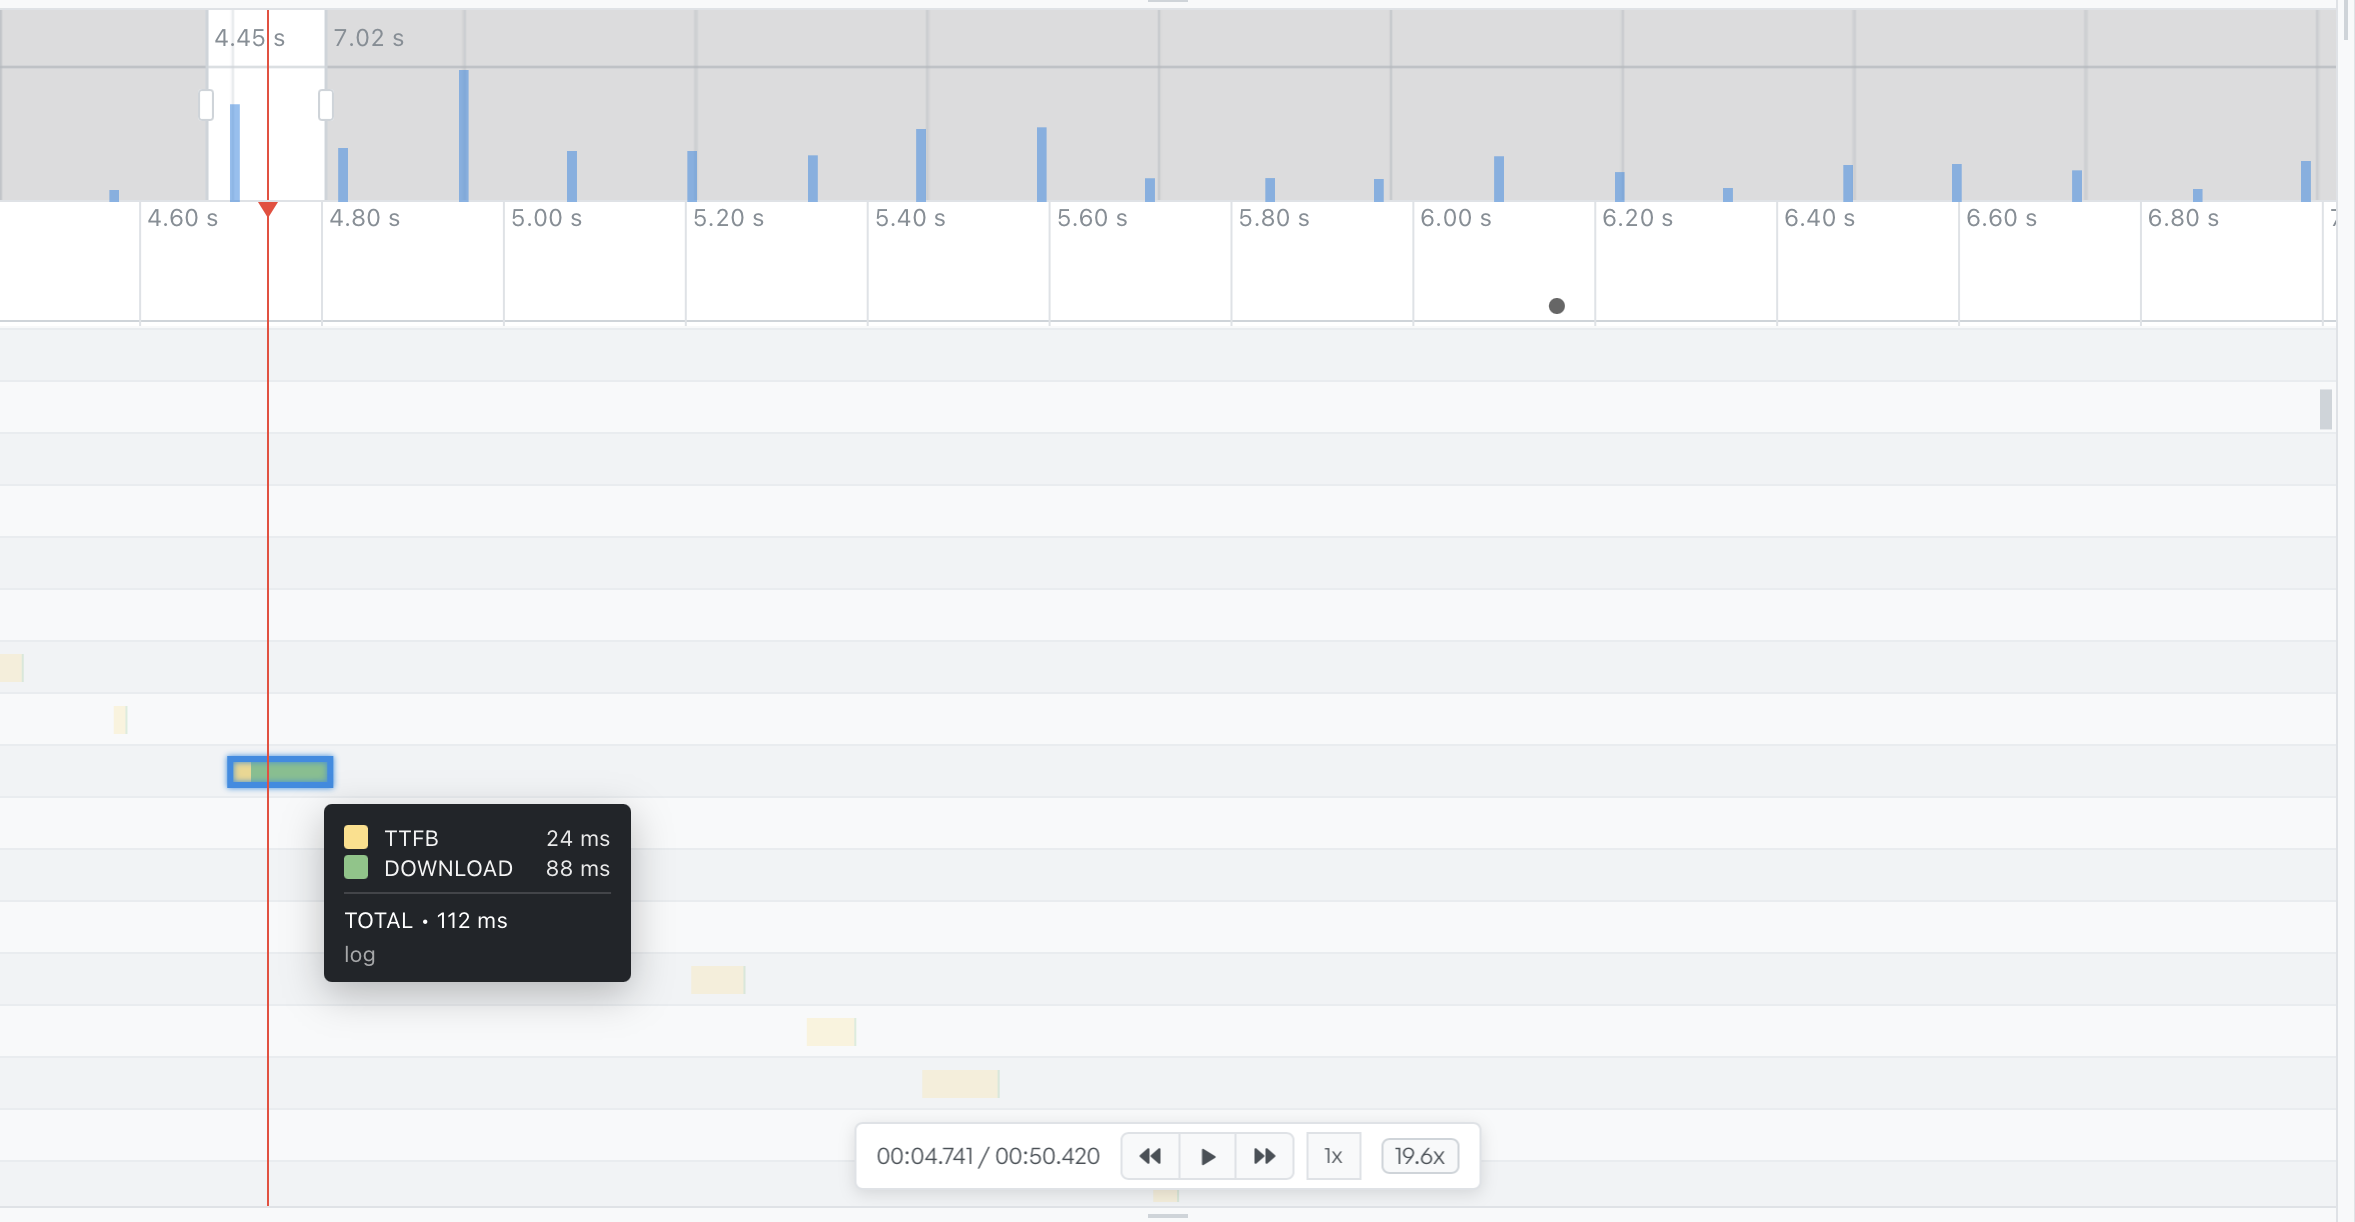
Below the activity markers, the timeline draws each network request as its own row: a bar of coloured segments, one per phase of the request. The bar tells you where a request spent its time.
Read the phase segments#
A bar runs left to right through the phases of a request: time blocked, DNS lookup, connection, the TLS handshake, wait for the first byte, and download of the response. Each phase has its own colour, so a long stretch of one colour shows you where the delay was.
Hover a request to see the breakdown: each phase with its time, and the total.
The timeline draws a request that took no measurable time as a small diamond instead of a bar, so it is still visible.
Open the request detail#
Select a request on the waterfall to move the playhead to the moment the request started, which lines the preview up with it. To read the request and response in full, open the request from the events list: select a network row there to load it into the network inspector.