What the events list collects#
Work through one time-ordered table of actions, events, console messages, and network requests, and select any row to open it.
The events list is one table of everything that happened, in time order: the actions your script ran, the events the page fired, the console messages, and the network requests. It is the main way to move through a trace row by row and to open anything in the inspector.
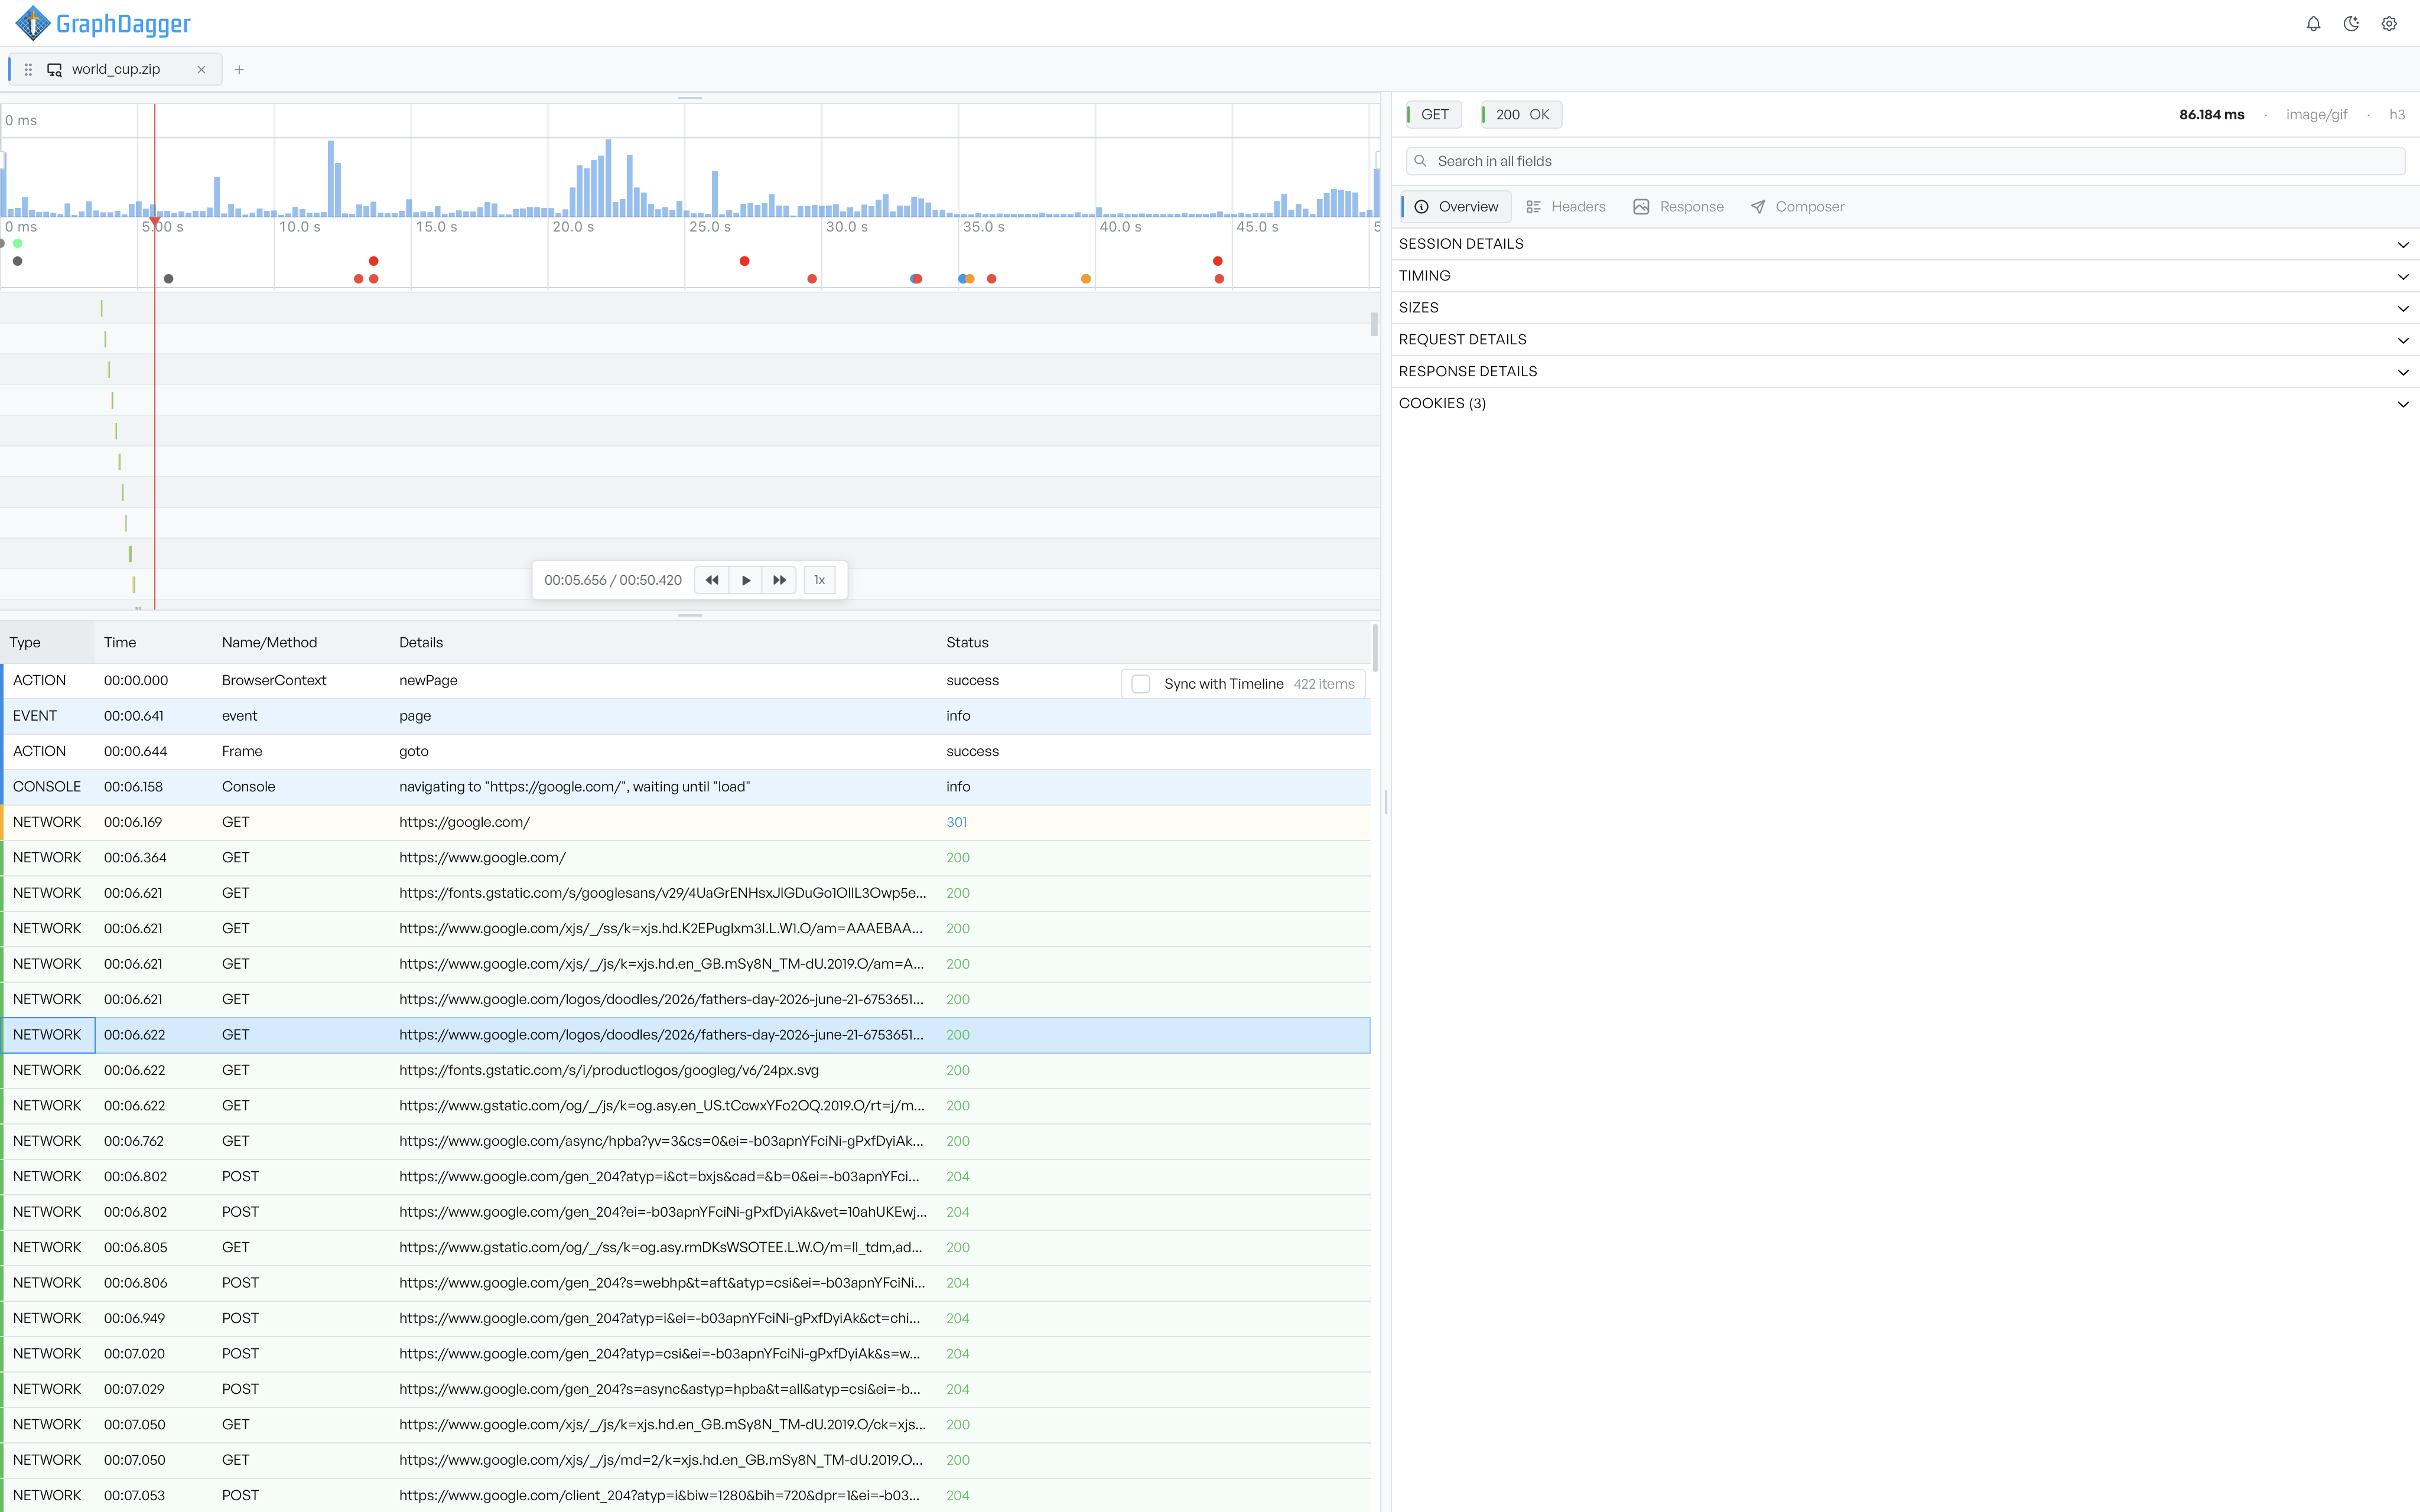
Each row carries its kind in the Type column and a coloured left edge, so you can tell actions, events, console messages, and network requests apart as you scan. Network rows also colour their status code, so a failed request stands out.
Select a row#
Select a row to load it in the inspector on the right. The inspector shows the right kind of detail for what you select: an action, an event, a console message, or the full request and response for a network row.
Tie the list to playback#
The Sync with Timeline switch sits above the table on the right, and it keeps the list tied to playback. While it is on, the list hides anything that happens after the current time. The table grows as the run plays, so you only see what has happened so far. The count next to the switch tells you how many rows the table shows. Turn the switch off to see every row at once.
Shape the list to the run#
The table shapes around the run in front of you:
- Default columns explains what each column shows.
- Customising columns explains how to show, hide, pin, and add columns.
- Filtering explains how to narrow the list.
- Copying rows explains how to get data out.
- Annotations explains how to mark rows up with colours and comments.