What Playwright Inspector replays#
Open a recorded browser session and step through the page, the actions, the console output, and the network calls on one clock.
Playwright Inspector replays a recorded browser session. You open a Playwright trace and step through it like a video: the page as it looked, the actions your script ran, the events the page fired, the console output, and every network request, all lined up on one clock.
Use it to see why a test failed, to watch what a page did, or to read the request and response behind any network call.
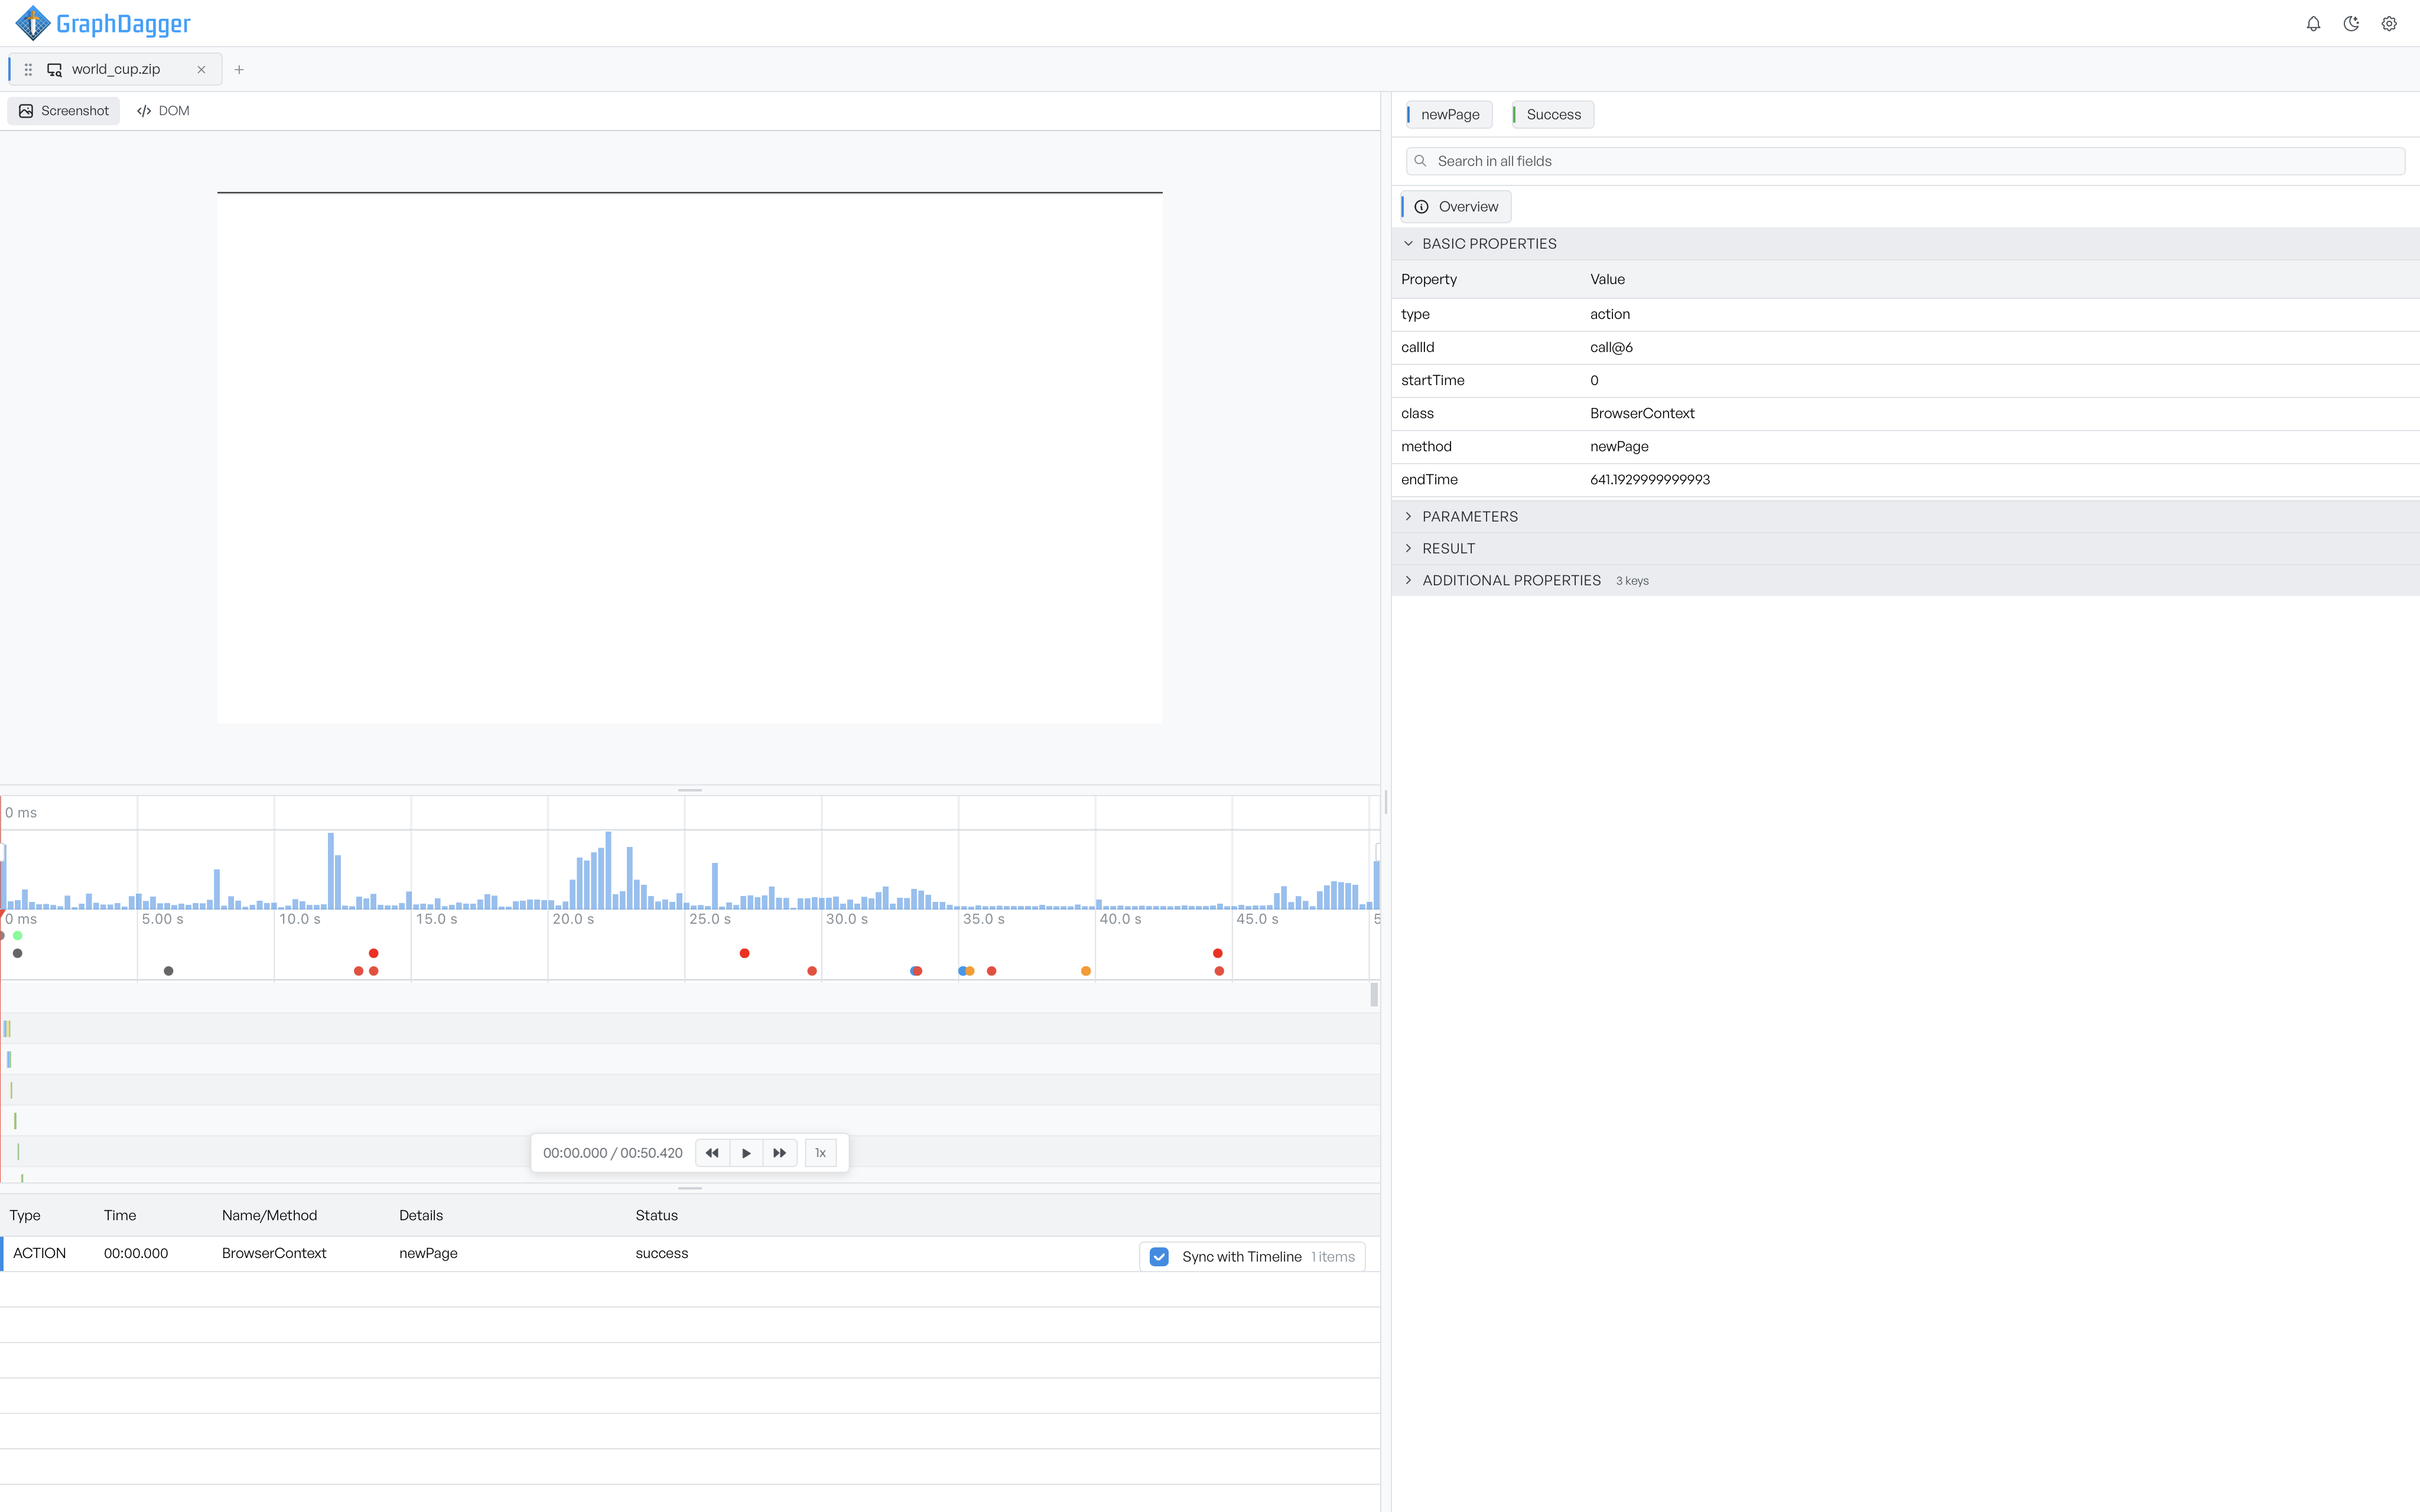
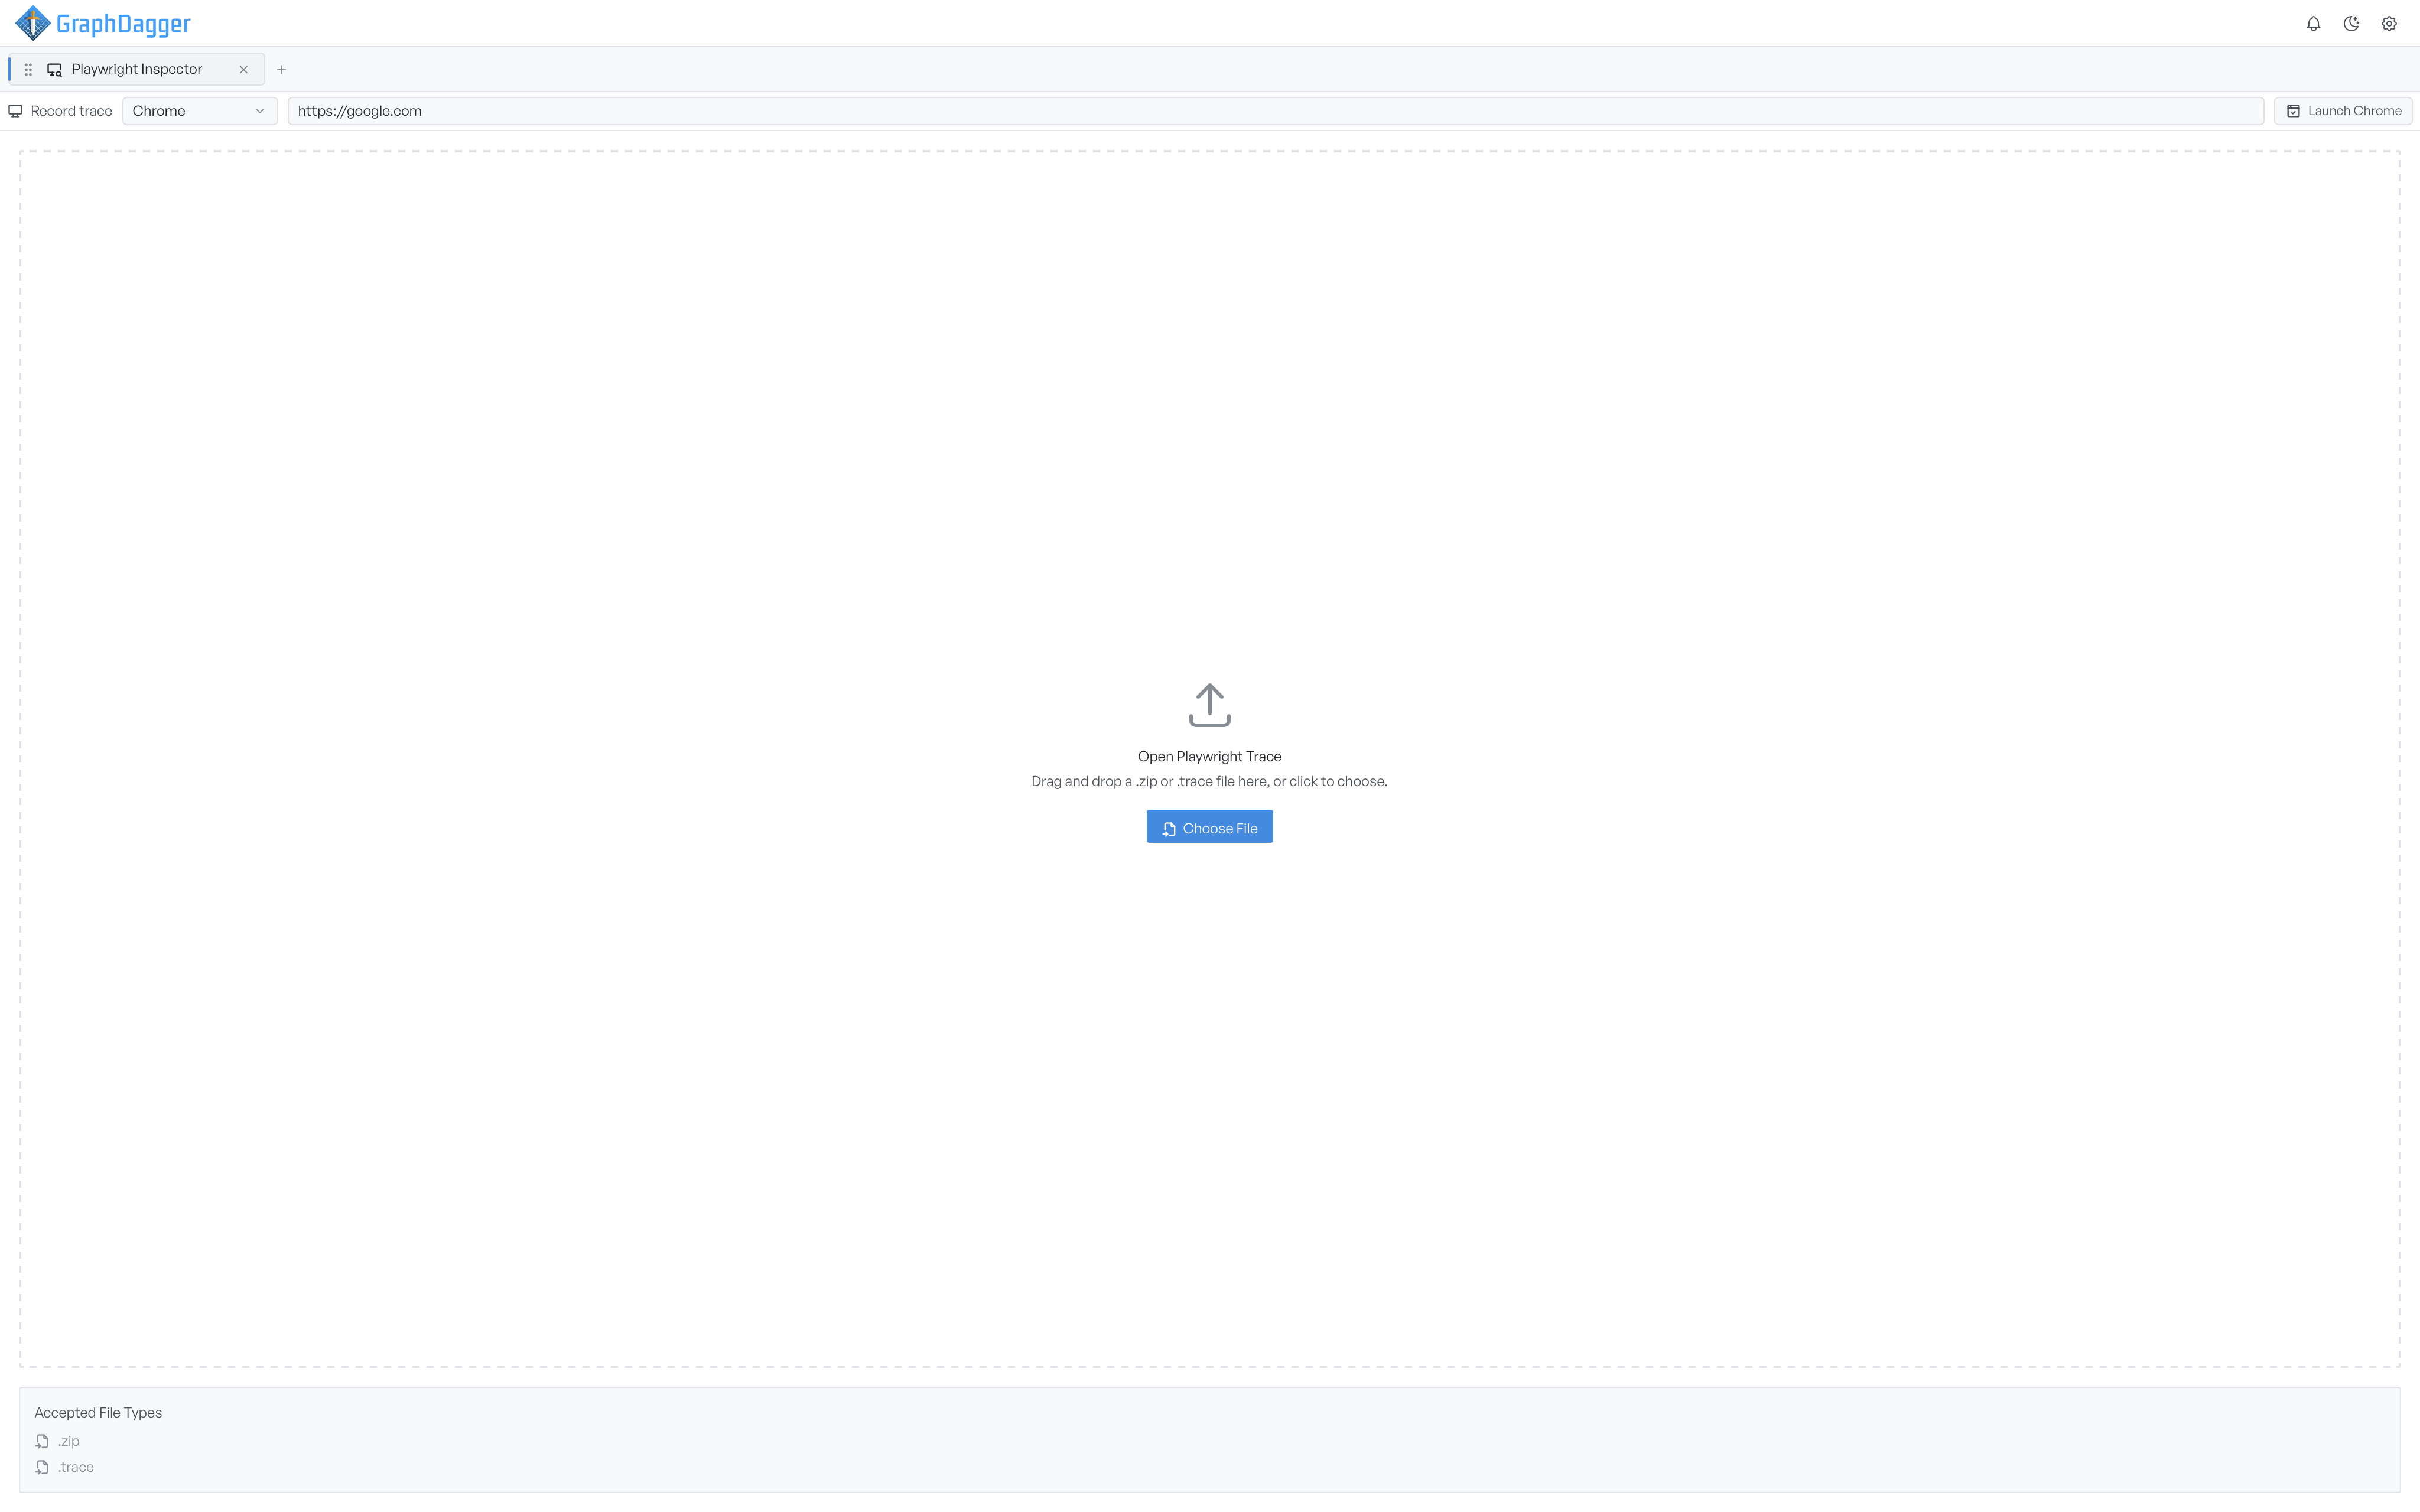
Open a trace or record one#
A fresh tab shows a start screen with two ways in. Drop a trace file you already have onto the drop zone, or record a new one.
- To open a file, drag a
.zipor.traceonto the drop zone, or select Choose File. See Opening a trace file. - To capture one, use the Record trace toolbar at the top of the start screen. See Recording a trace.
Once a trace loads, the tab takes the name of the file.
Where each panel sits#
The workspace has two sides. The left side stacks the page preview, the timeline, and the events list. The right side is the inspector, which shows the detail of whatever you select.
You can drag every divider, so you can give the preview, the timeline, or the events list more room, or collapse one you do not use.
The three left-hand regions and the inspector all track a single current time. Move the playhead and the preview, the timeline, and the selected row move with it. How it works explains that model.
Where to go next#
- Snapshot and playback covers the preview and the play controls.
- The timeline covers the activity markers and the network waterfall.
- The events list covers the unified table.
- The inspector covers the right-hand detail panel.