Read a request and response#
Open the shared request inspector on a network row to read its headers, its body, and its timing.
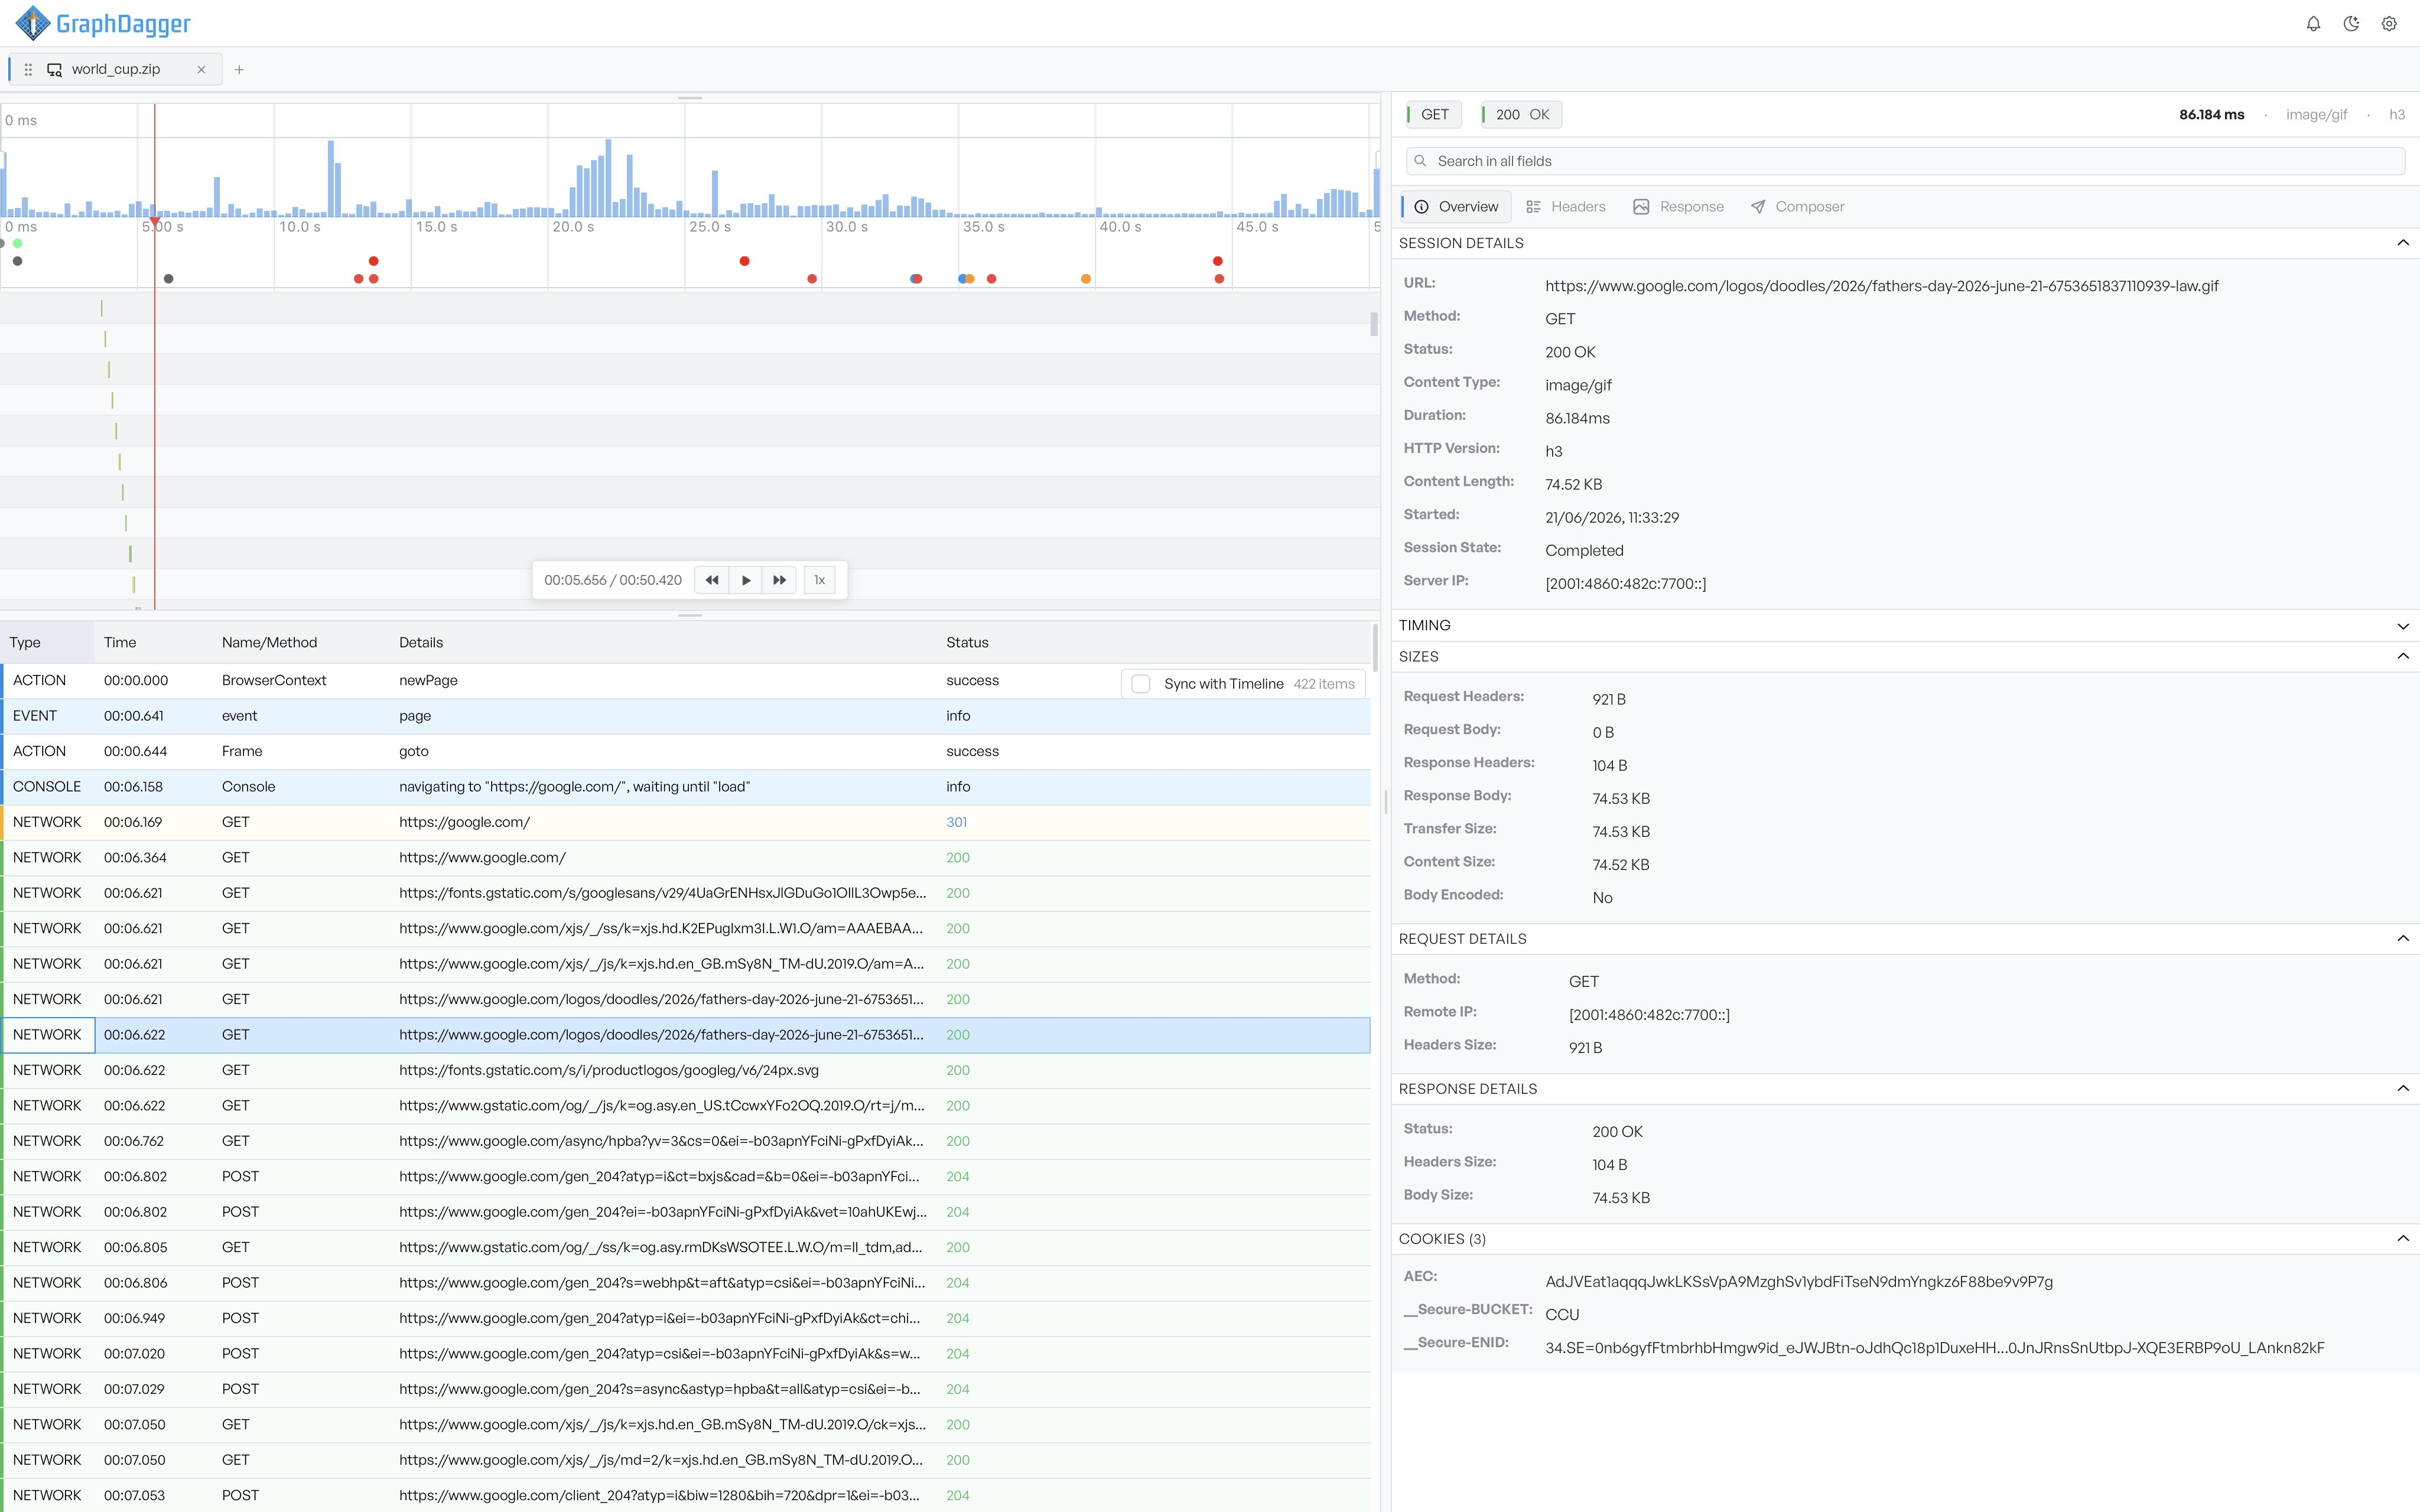
Select a network row and the inspector shows the full request and response. It is the same request inspector the Web Debugger uses, so a request captured in a trace reads exactly like one captured live.
The header sums the request up: the method, the status, how long it took, the content type, and the protocol.
Read the request tabs#
The Overview tab groups the request into readable sections: the session details (URL, method, status, timing), the sizes of each part, the request and response detail, and the cookies. Sections such as timing, query parameters, and security detail appear when the request has them.
The other tabs cover the rest:
- Headers lists the request and response headers.
- Response shows the response body.
- Composer lets you take the request, change it, and send it again.
A request also gains a Request or Form Data tab when it carried a body.
This is the shared request inspector, so the Web Debugger documents its tabs in full. See Inspector tabs.