Read an action's outcome#
Read the parameters, the result, any error, and the stack trace behind a Playwright call your script made.
When you select an action, the inspector shows what your script asked the browser to do, and what came back. The header names the method, marks it as a success or an error, and shows how long it took.
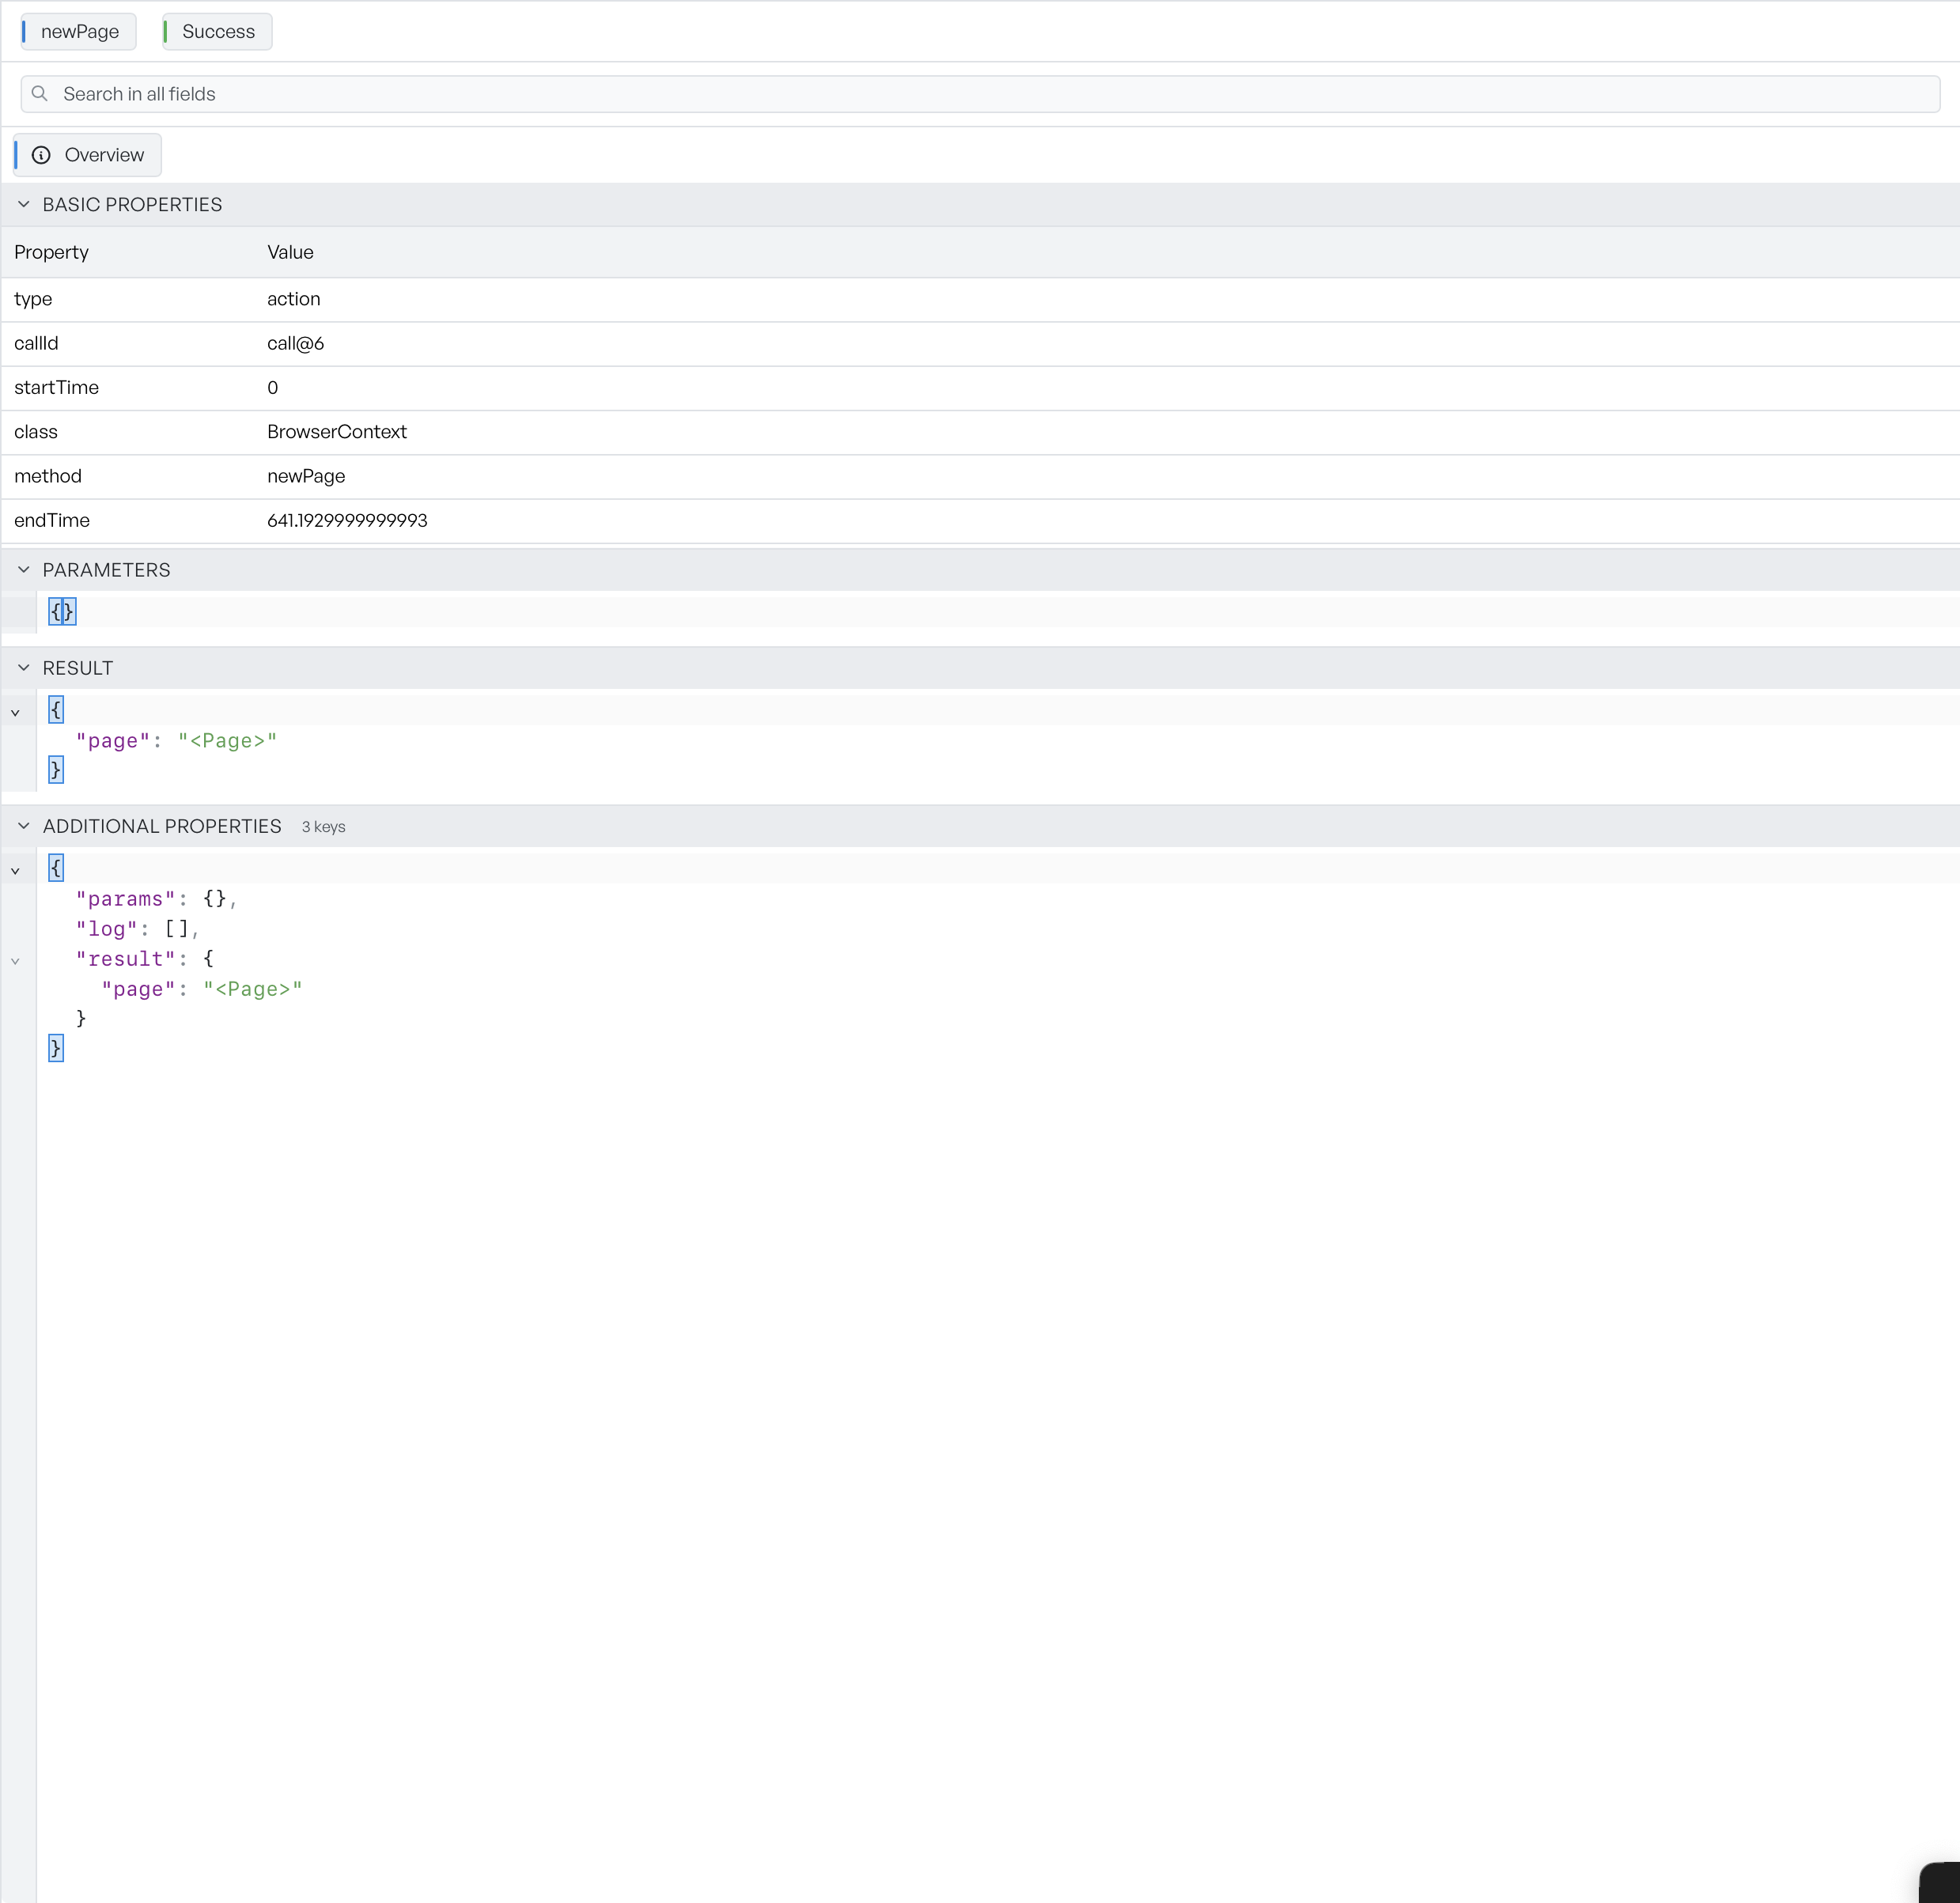
Read the Overview tab#
The Overview tab reads from top to bottom, from the summary to the fine detail:
- Basic Properties are the plain facts of the action, such as its class, method, and timing.
- Parameters are the arguments the call used.
- Result is what the action returned.
- Error appears only when the action failed, and it holds the failure detail. The inspector flags it, so a failed action is hard to miss.
- Additional Properties gathers anything else the action carried, as JSON.
Read the Stack Trace tab#
When an action recorded a stack trace, a Stack Trace tab appears next to Overview and shows it. You can see the line in your script that drove the call. An action without a stack does not show the tab.
Open the Elements tab#
If you select an element from the page in DOM mode, an Elements tab appears with its locator, attributes, and markup. See Inspecting elements.
Related screenshots#
The action inspector also appears in context on other pages:
- Snapshot and playback: the inspector open on an action beside the page it produced.
- Overview: the whole workspace with an action selected.