What the Graph tab links#
The active file sits at the centre of everything in your library that shares an indicator, a fingerprint, or a carving relationship with it.
The Graph tab shows the active file as a node in a graph of related files and indicators. Use it to see what else in your library shares a domain, an IP, a path, a fingerprint, or a carving relationship with this file.
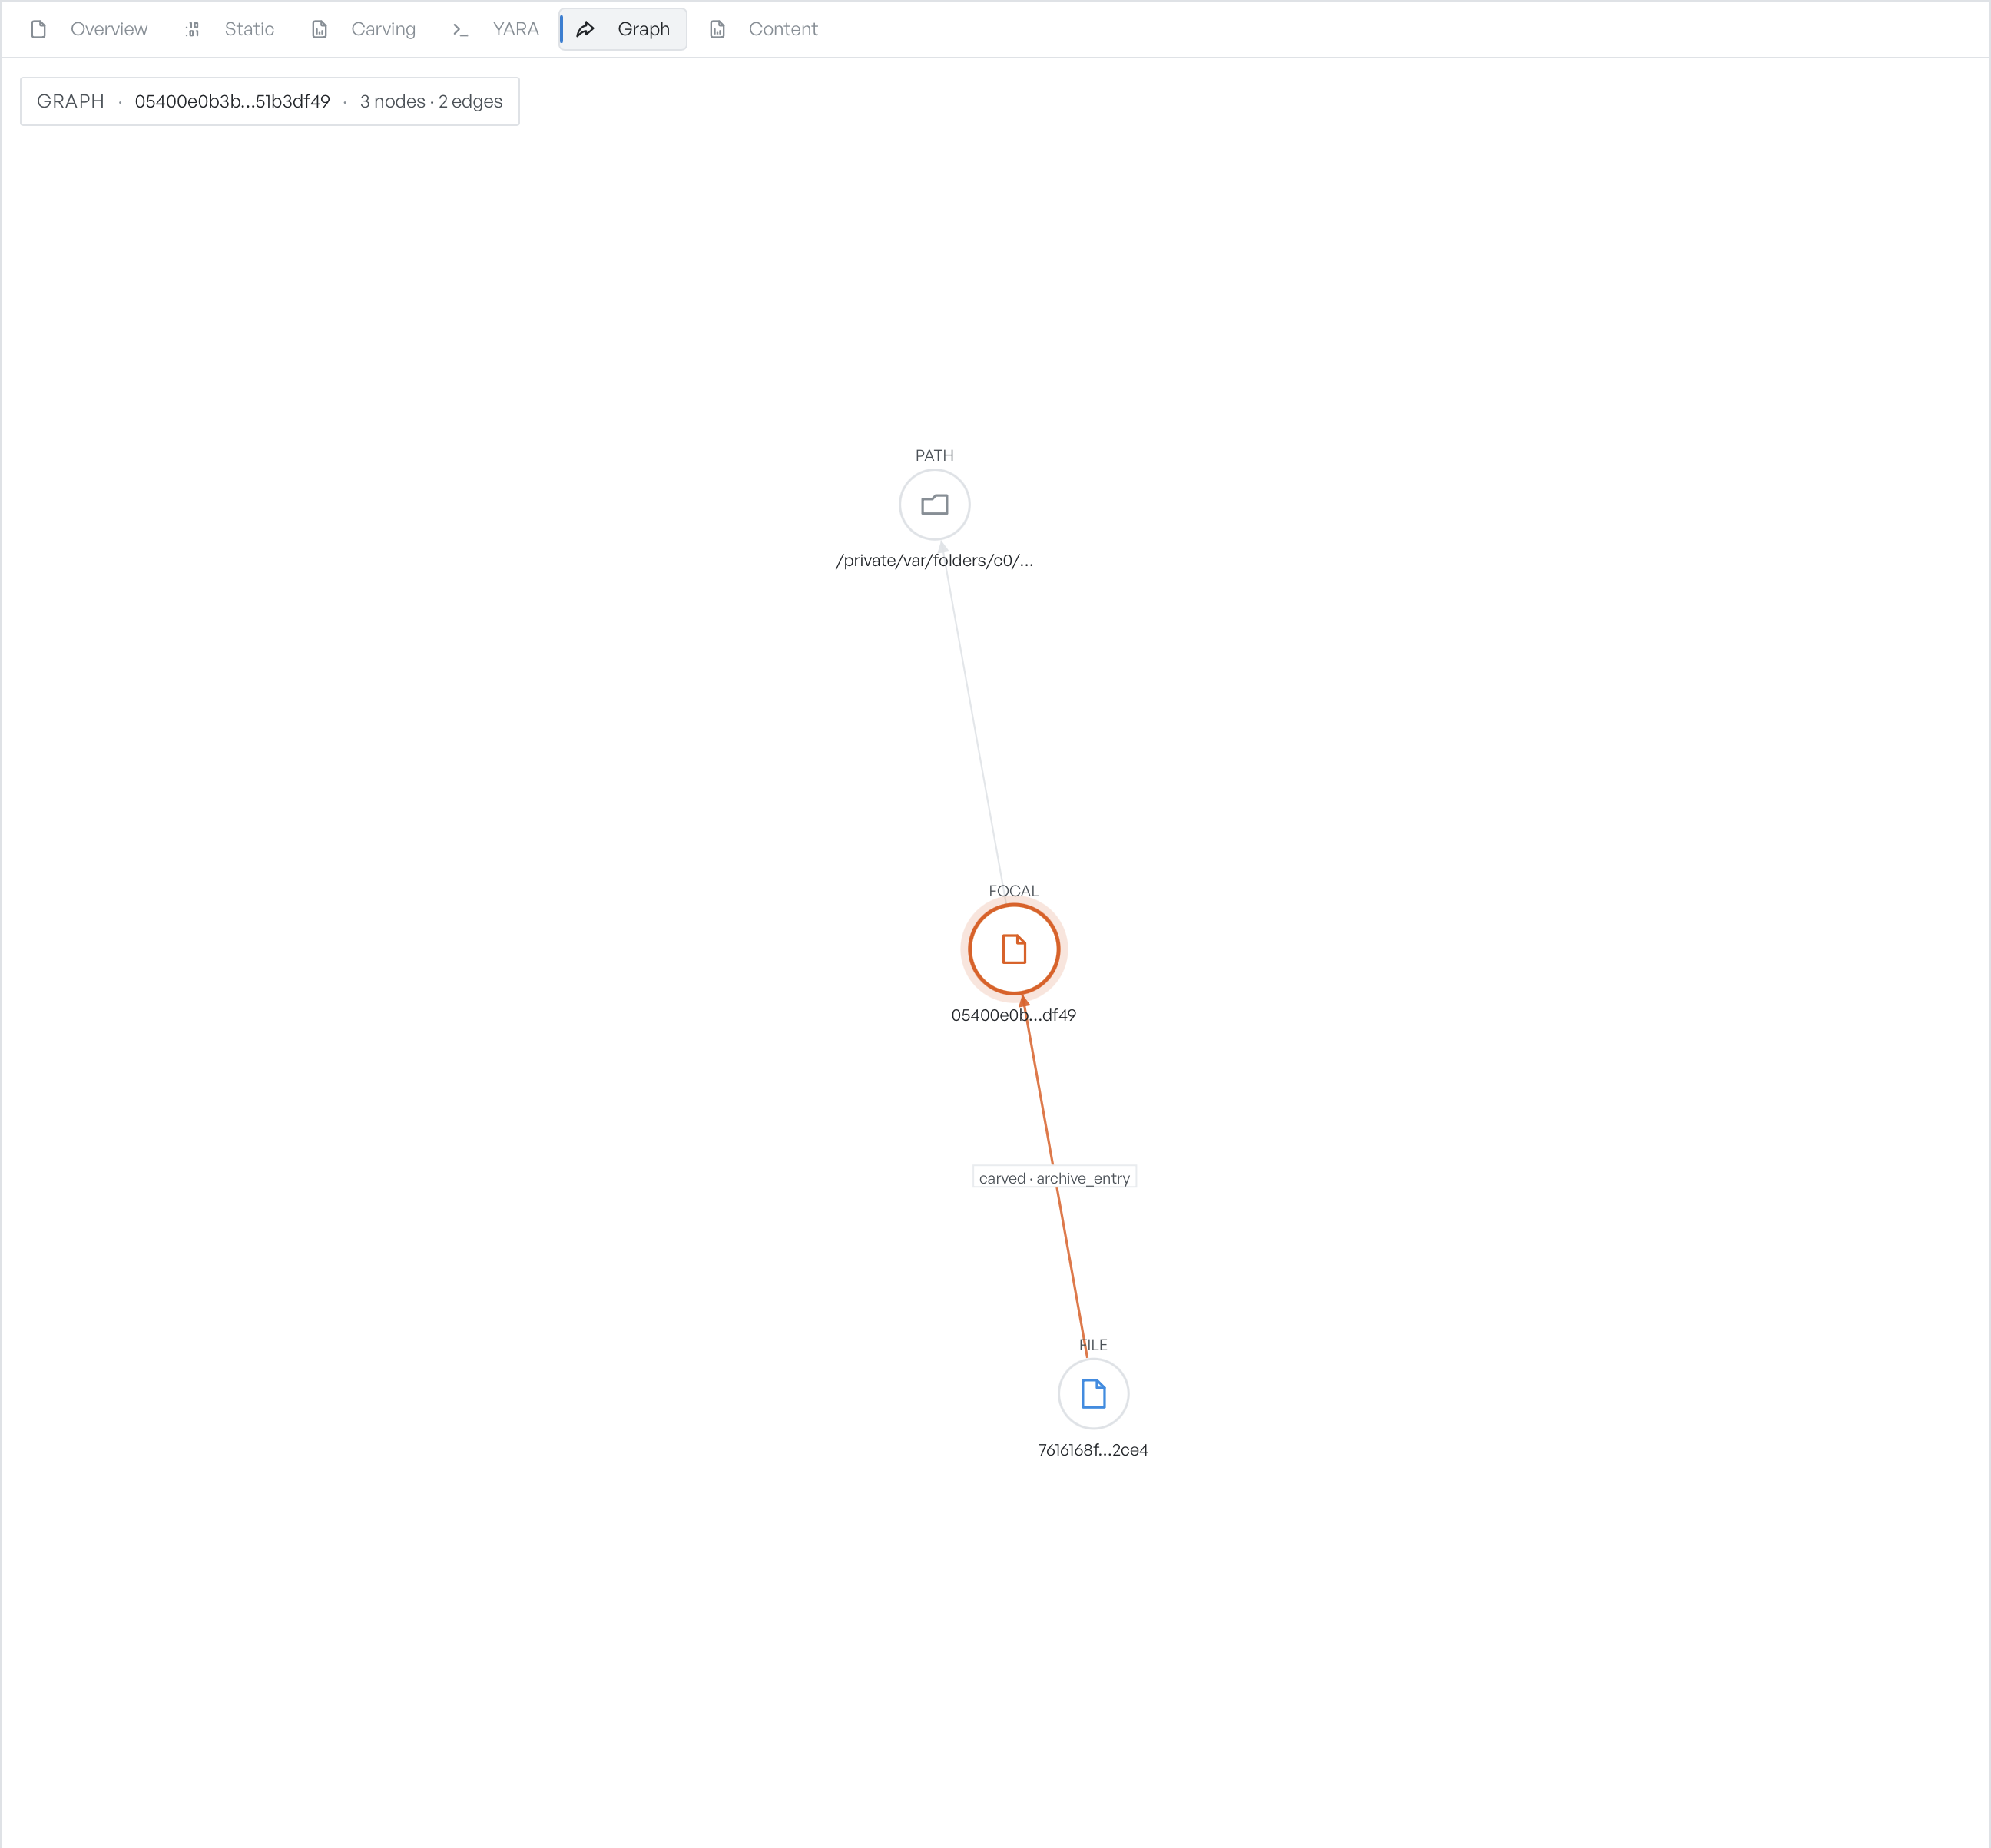
What is in the graph#
GraphDagger builds the graph around the active file's SHA-256, the focal node. The graph highlights the focal node and lays out the related nodes around it.
- File nodes are other files in your library. Each one shares an indicator with this file, came out of it through carving, or has a similar fingerprint by SSDEEP, IMPHASH, or TLSH.
- Indicator nodes are the indicators from the focal file: domains, IPs, URLs, paths, and email addresses. Each kind has its own icon, and a path node carries a
PATHchip. - Edges connect the focal file to its indicators and to related files. An edge carries a relation label when the link is a similarity or a carving relationship, for example
carved · archive_entryfor a file carved out of an archive. The graph draws structural links without a label.
An overlay shows the focal SHA-256, the node count, and the edge count. When the result is large, a Result truncated at 200 nodes. notice appears.
Open a node detail card#
Click any node to open a detail card. For a file, the card shows the full hash, the size, the first and last seen dates, and any tags. For an indicator, it shows the value and its first and last seen dates. An Edges list marks the direction (→ outgoing, ← incoming), the relation, and the peer on the other end.
Clustered nodes#
When more than a handful of nodes share the same hostname or path prefix, they collapse into a cluster node with that host as its label. Click a cluster to expand it and show the members. Click again to collapse it. The overlay shows a … clustered count while any clusters stay collapsed, so you keep track of how many nodes are hidden.
When the graph is empty#
The first time you analyse a sample, GraphDagger knows no related files yet. The tab shows the message No related samples found yet. Analyze more files to populate the graph around this sample. Add more files, and the graph fills out over time. If a graph build fails, an error message appears on the canvas.