What File Triage inspects#
Learn how the queue, the centre tabs, and the report panel work together on one file, and which analysers run the moment you open it.
File Triage is the workspace for inspecting a single file in depth. This page covers the shape of the workspace and how each region fits together.
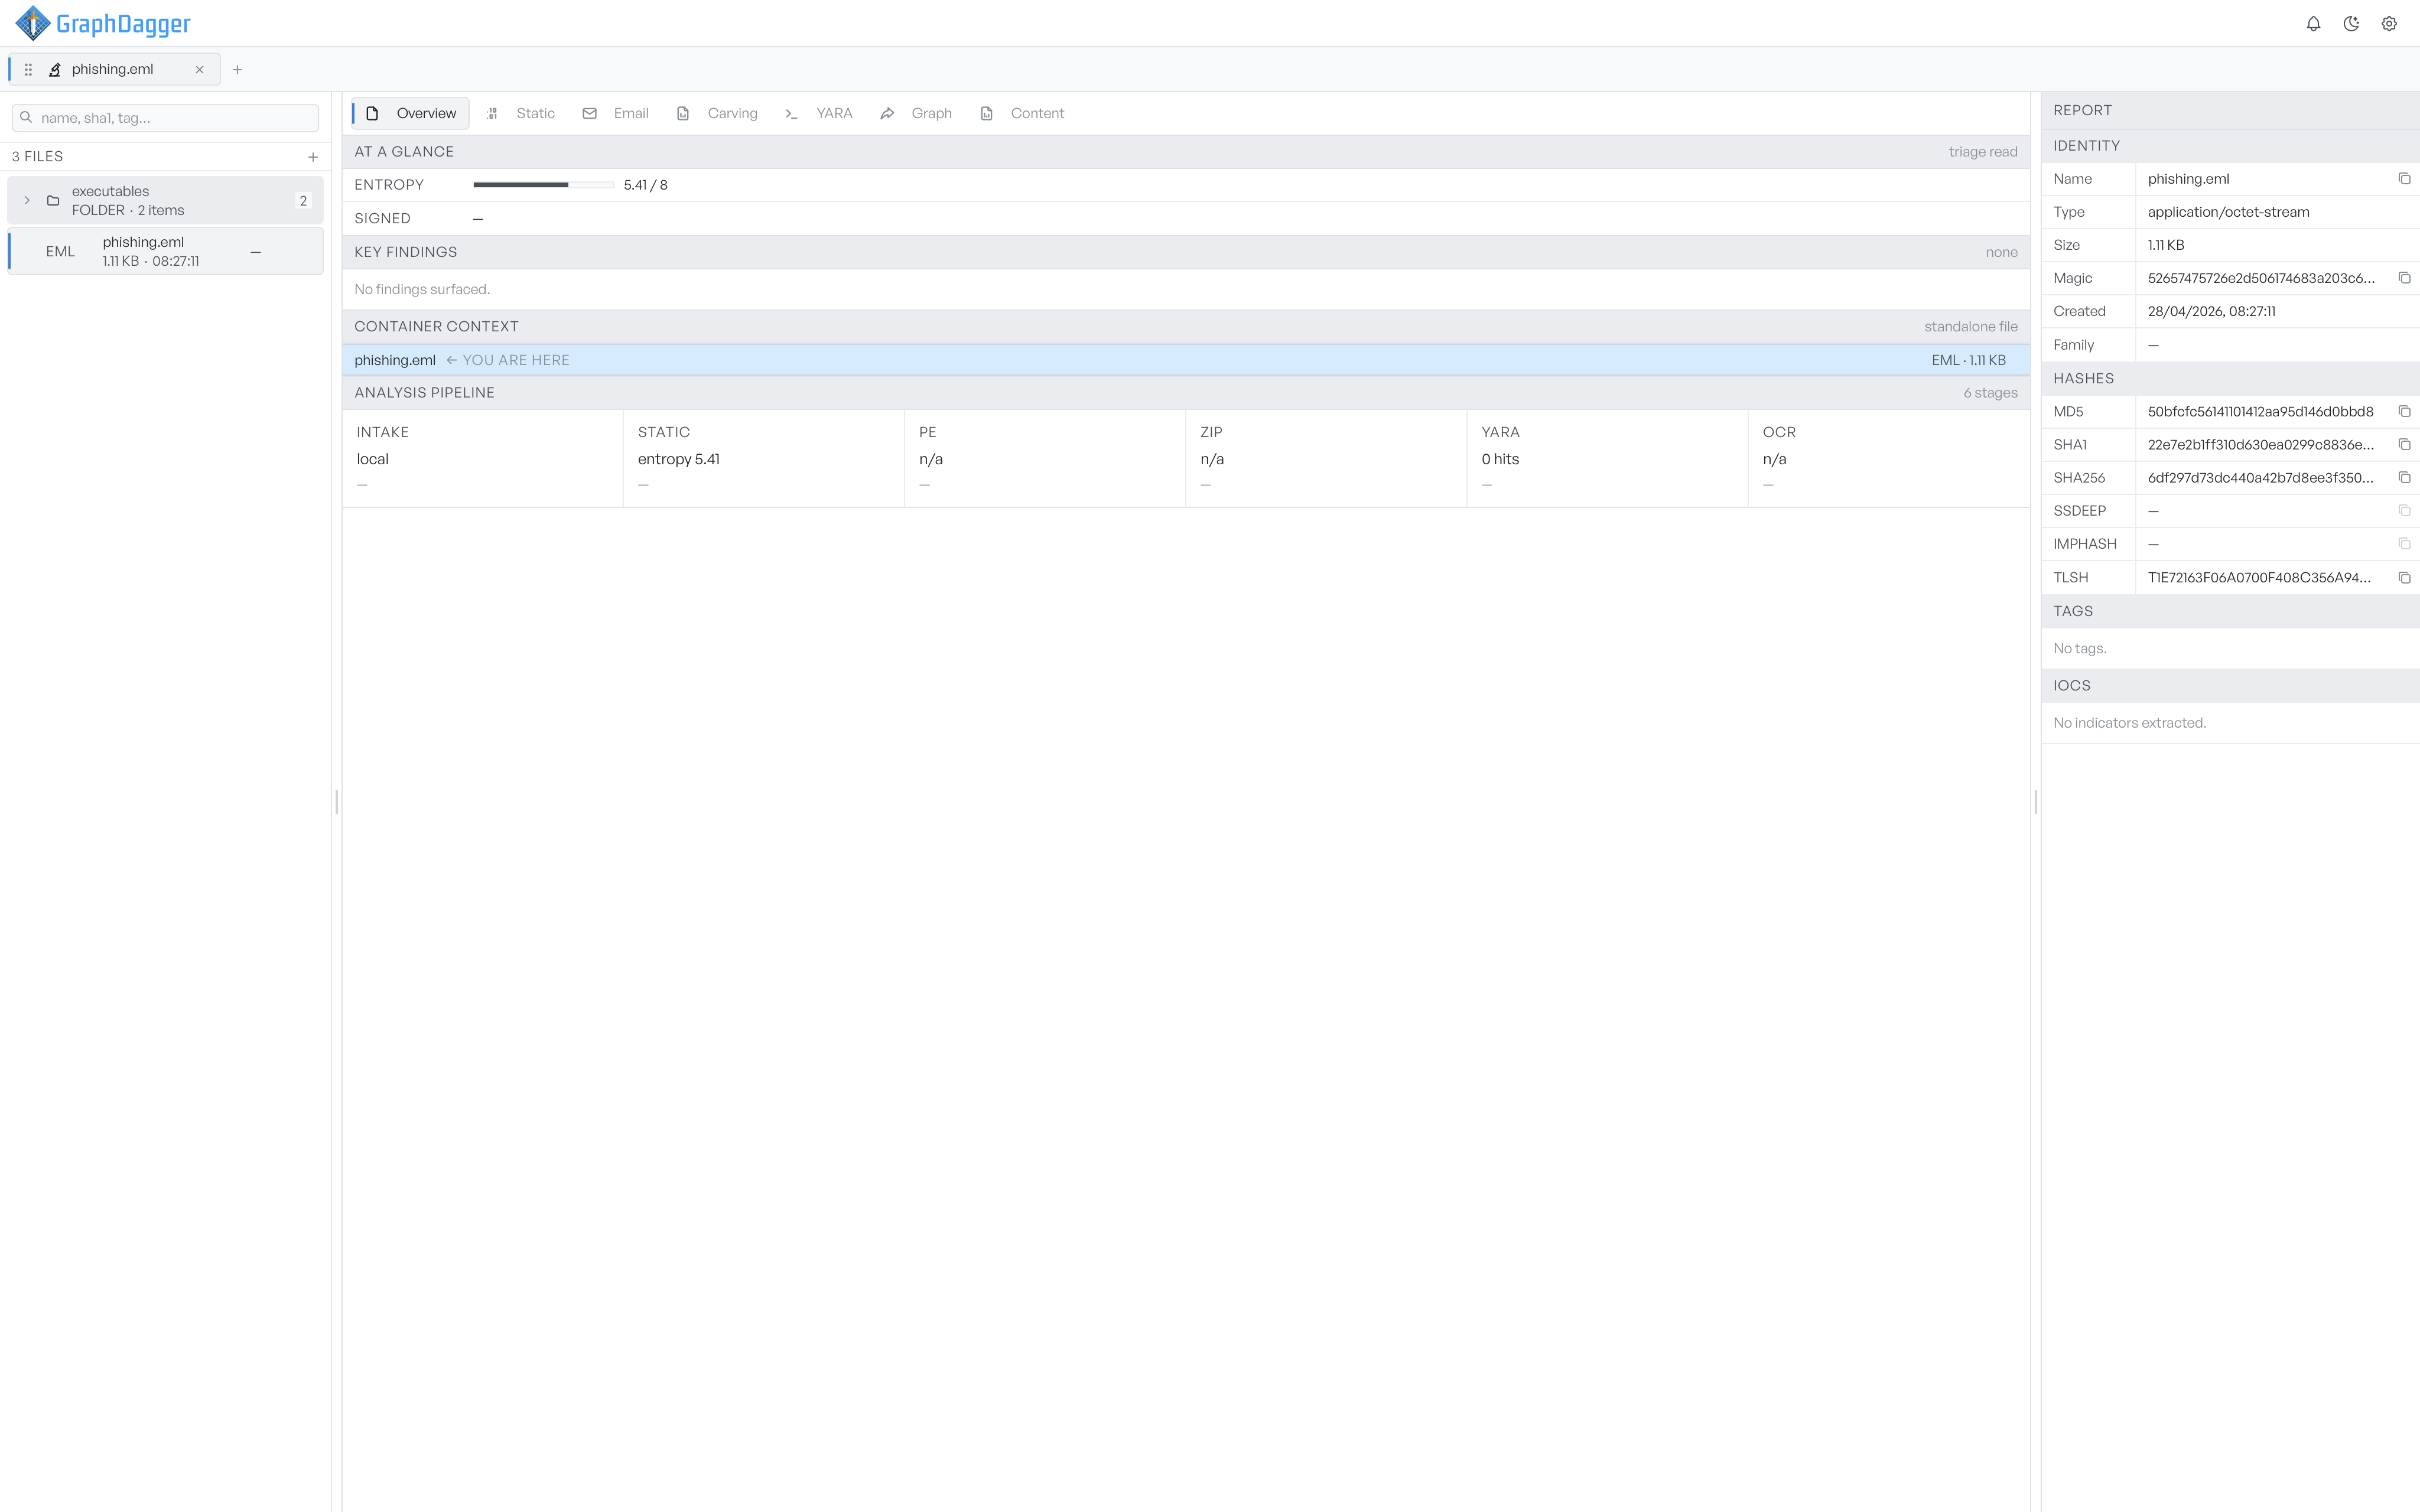
The three workspace columns#
The workspace has three resizable columns.
- Queue on the left. It lists the files you have added in this tab, with type, size, and the time you added each one. Archives expand into a folder tree of their contents.
- Centre in the middle. A row of tabs runs across the top. Each tab shows one analysis surface for the active file. Overview, Static, Carving, YARA, Graph, and Content are always present. Format-specific tabs (Email, PE, ELF, Mach-O, and so on) appear only when the file matches that format.
- Report on the right. This fixed identity panel mirrors the active file's name, type, size, hashes, tags, and extracted indicators. It does not change as you switch tabs.
Drag the dividers between the columns to resize them. Drag a column past its threshold to collapse it.
What is the active file#
The active file is the one you select in the queue. Every centre-column tab shows analysis for that file, and the report panel on the right tracks it. Select a different file in the queue to switch the active file. If GraphDagger has not analysed that file yet, the analysis runs again.
What opening a file runs#
When you open a file, GraphDagger runs static analysis: hashing, signature detection, byte stats, entropy, string extraction, carving, and any format-specific parser that matches the magic bytes. YARA and OCR are not part of this default pipeline. You start them by hand from their own tabs.
Where to go next#
- Opening files covers how to add a file.
- The queue covers managing the queue.
- The Overview tab is the first read on any file.