Connection Table#
Sort every pair of addresses by packet count or traffic share, then highlight a pair in the timeline.
The Connection Table lists every unique pair of addresses seen in the capture, with one row per pair. Use it when you need exact numbers and a sortable list.
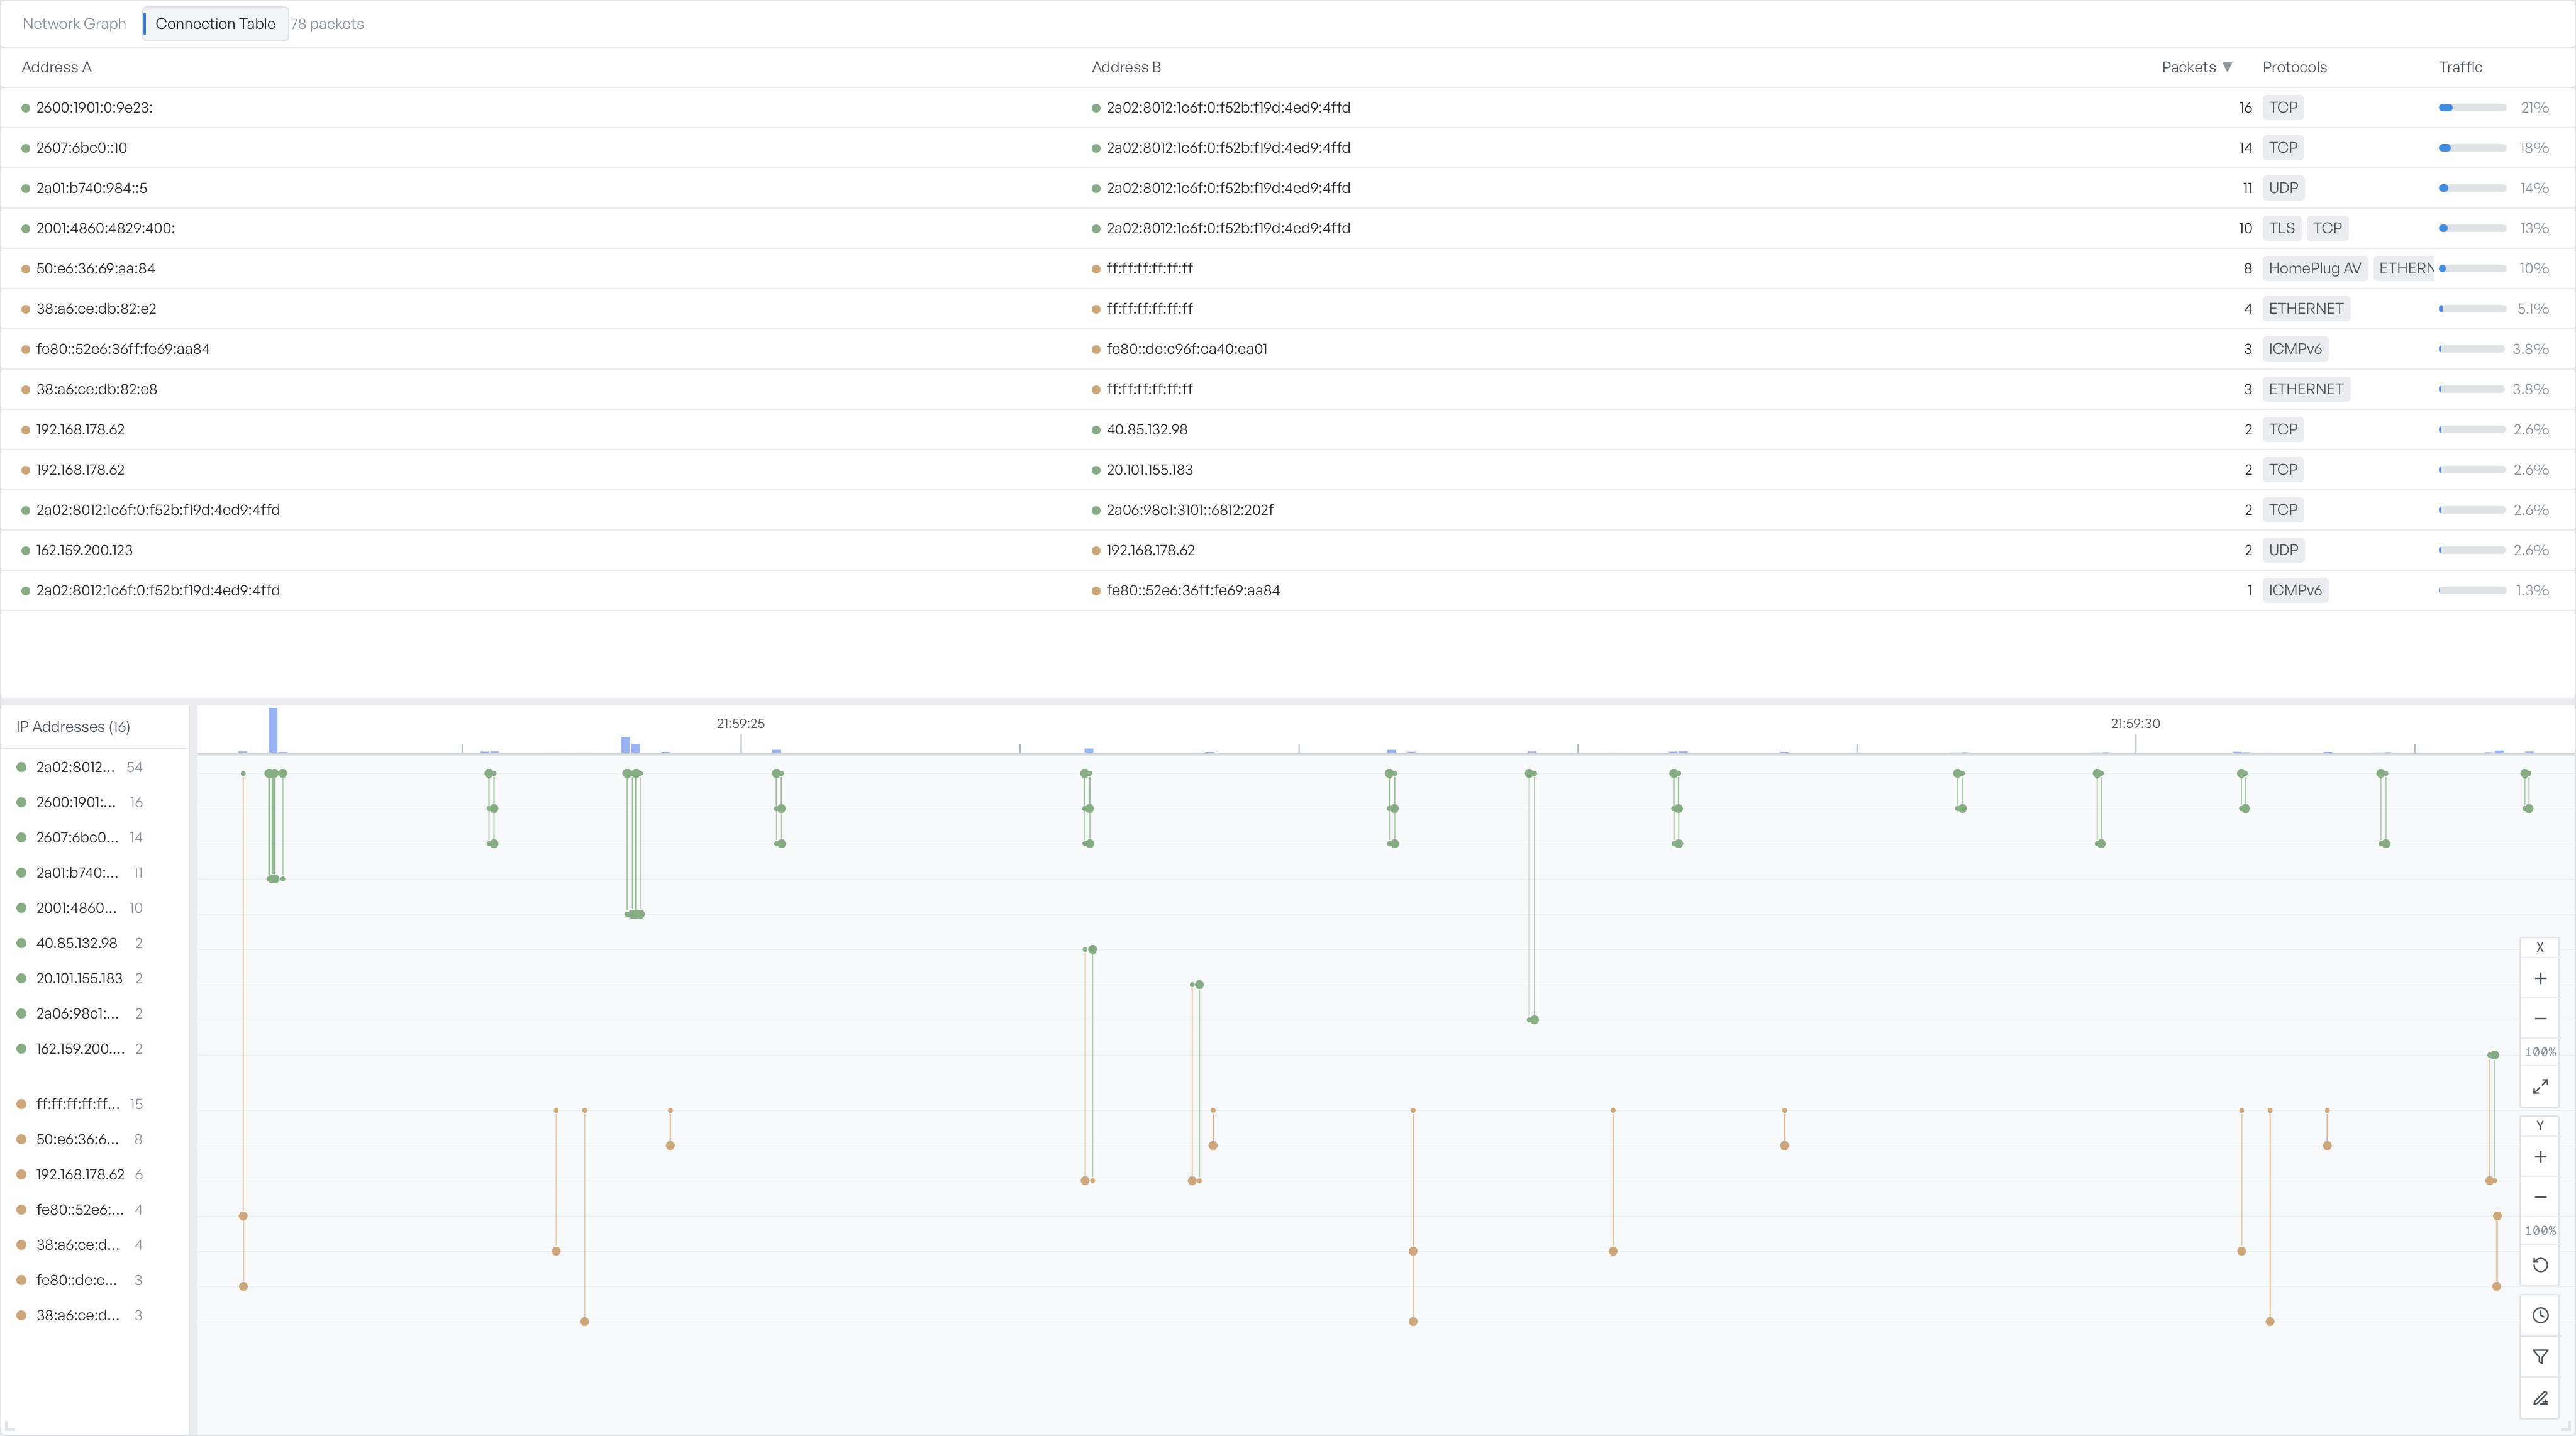
What each column shows#
| Column | What it shows |
|---|---|
| Address A | One endpoint of the pair. |
| Address B | The other endpoint. |
| Packets | The number of frames exchanged between A and B. |
| Protocols | Every protocol the workspace detected on this pair, shown as chips (for example, TCP, TLS, DNS). |
| Traffic | The percentage of the capture's total traffic that this pair represents, rendered as a bar with the percentage to the right. |
The two addresses are interchangeable. The pair A→B and B→A is one row, and the table sums the packet count in both directions.
Sort by packets or traffic#
Select any column header to sort by that column. Select it again to reverse the order. Sort on Packets to find the busiest pairs in the capture. Sort on Traffic to find the largest pairs by volume. The two orders can differ when one pair sends a few large frames and another sends many small ones.
Highlight a pair in the timeline#
Select a row to highlight both endpoints in the timeline at the bottom of the view. The highlight shows exactly when the pair exchanged traffic. Deselect the row, or select a different row, to update the highlight.
When the table is empty#
The table contains a row only when the workspace has seen at least one frame between two addresses. If the capture has only begun, or the current filter matches no frames, the table reads 0 rows. Adjust or clear the filter on the toolbar and the table populates.
Switch to the graph#
For a structural picture rather than a row-by-row list, switch to the Network Graph tab. To see when each address was active, look at the Timeline underneath.