What Packet Capture shows#
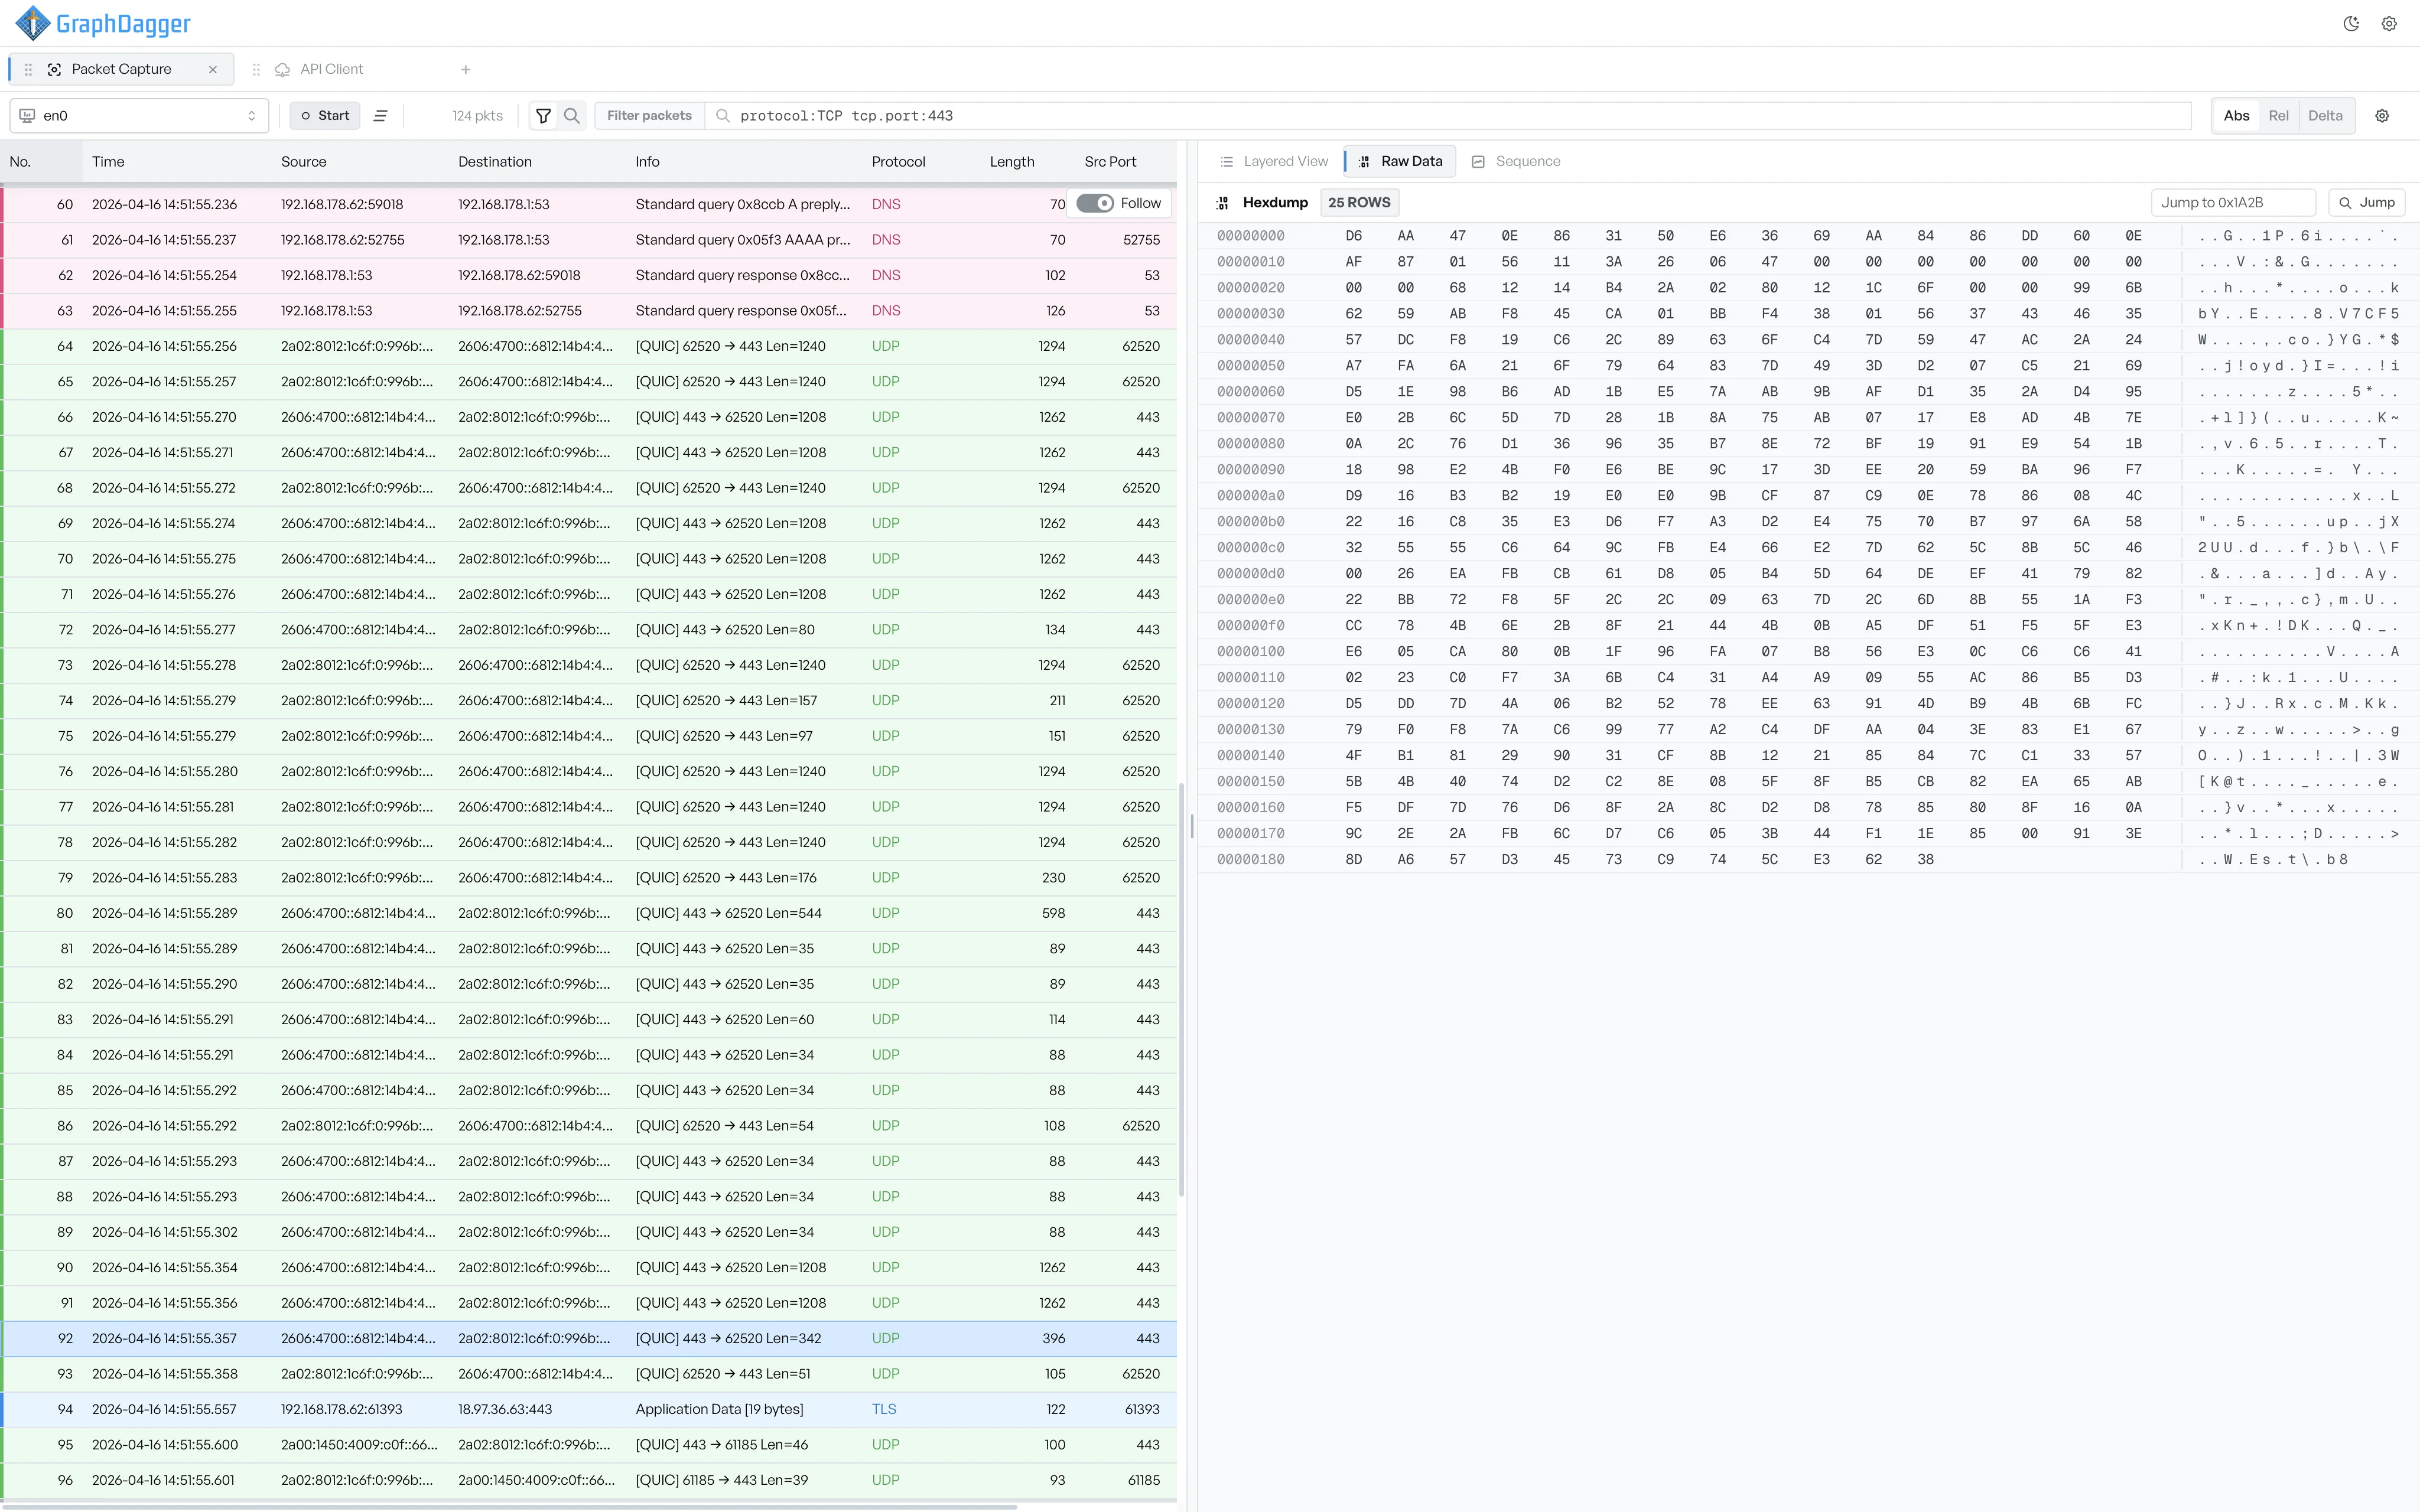
See how the packet list, detail pane, toolbar, and settings menu fit together in one capture workspace.
Packet Capture records live network traffic from any interface on your machine and turns it into an interactive workspace. The packet list fills as frames arrive. The detail pane shows the protocol breakdown, hex bytes, and conversation view for whichever frame you select.
Jump to a task#
- Start a live capture on any interface and watch frames stream into the list.
- Open a saved pcap file and analyse it in the same workspace.
- Filter the list with field-based expressions and pills.
- Search payloads for matching text.
- Inspect each frame layer by layer.
- Follow a TCP stream to read the payload a conversation carried.
- Mark packets with colours and comments as you investigate.
- Map the connections in the capture as a graph and a table.
- Plot any column on a chart.
- Export the capture to a
.pcapfile.
The toolbar#
The toolbar carries these controls:
- Interface dropdown: selects the adapter to capture on.
- Start and Stop: begin and end the capture. The broom icon next to them clears the list.
- Filter or search toggle: switches between the filter bar and the search box.
- Abs, Rel, and Delta: sets the time display mode.
- Cog icon: opens the settings menu.
The settings menu#
The cog icon opens a menu with these options:
- Import PCAP: loads a saved capture file. See Opening a pcap file.
- Export All: writes every captured frame to a
.pcapfile. See Exporting a capture. - Export Options: selects a range of packet IDs before you export.
- Forensic Timeline: opens the connection-level views. See Mapping connections.
- Permission Help: opens the Dependencies settings to fix capture permission errors. See Capture permissions.
Working with multiple captures#
Each Packet Capture tab is independent. Frames, filters, time references, search results, and chart settings stay in the tab that holds them. You can compare two captures side by side, and their state does not leak across.