What the Forensic Timeline shows#
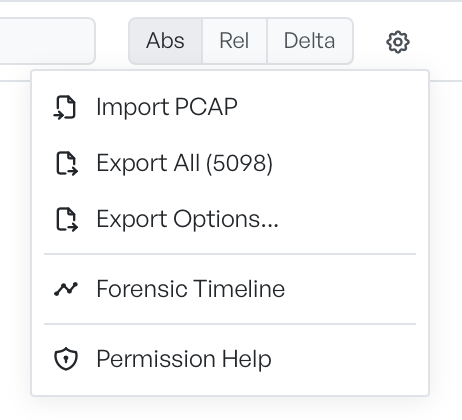
Open the connection-level view from the cog menu and move between its graph, table, and shared timeline.
The Forensic Timeline view turns a capture into a connection-level picture: a graph of how addresses cluster together, a table of every pair that exchanged traffic, and a per-IP timeline at the bottom. Use it to find busy pairs, spot disconnected groups, and line up traffic bursts with the addresses that caused them.
Open the Forensic Timeline#
Open the cog menu and select Forensic Timeline. The view appears over the workspace.
The view contains two top tabs and a shared timeline:
- Network Graph: communicating addresses drawn as clusters of nodes.
- Connection Table: every pair of endpoints in the capture, with packet counts, protocols, and traffic share.
- Timeline (always visible at the bottom): an address-by-time view of the capture.
The current capture filter applies, so anything you narrowed in the packet list also narrows the graph, the table, and the timeline.
What the view sees#
By default, the view shows every frame in the capture. If you select multiple rows in the packet list before you open the view, the view restricts itself to that subset. With a single row or no selection, the view shows the full capture.
The Forensic Timeline reads the same in-memory index as the packet list. The view therefore stays interactive even on long captures, and it shows new frames as a live capture continues.
Close and reopen the view#
The view sits inside the workspace as a draggable, resizable panel. Select the close button on its title bar to dismiss it and return to the packet list. Reopen it any time from the cog menu. The view remembers its size and position.